
Figure 2.
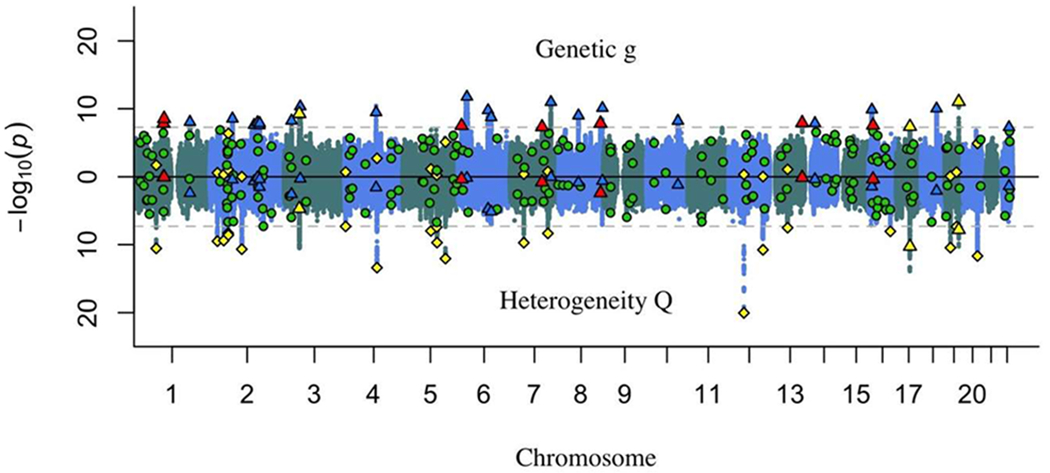
Miami plot of unique, independent hits for genetic g (top) and Q (bottom) (7,857,346 variants). The heterogeneity statistic (Q) indexes whether a SNP evinces patterns of associations with the cognitive traits that departs from the pattern that would be expected if it were to act on the traits via genetic g. Thus, genetic g loci in common with Q loci are false discoveries on genetic g. The dotted grey horizontal lines are the genome-wide significance threshold (p < 5×10⁻⁸). The genome-wide significant loci represented by the triangles, circles, and diamonds are represented both in the top and bottom panels of the Miami plot, with their locations corresponding to the −log10(p) of their associations with genetic g in the top panel, and the −log10(p) of their Q statistic in the bottom panel.
Red triangles  : genetic g loci unique of univariate loci.
Blue triangles  : genetic g loci in common with univariate loci.
Green circles  : univariate loci unique of genetic g loci.
Yellow triangles  : genetic g loci in common with Q loci.
Yellow diamonds  : Q loci unique of genetic g loci.