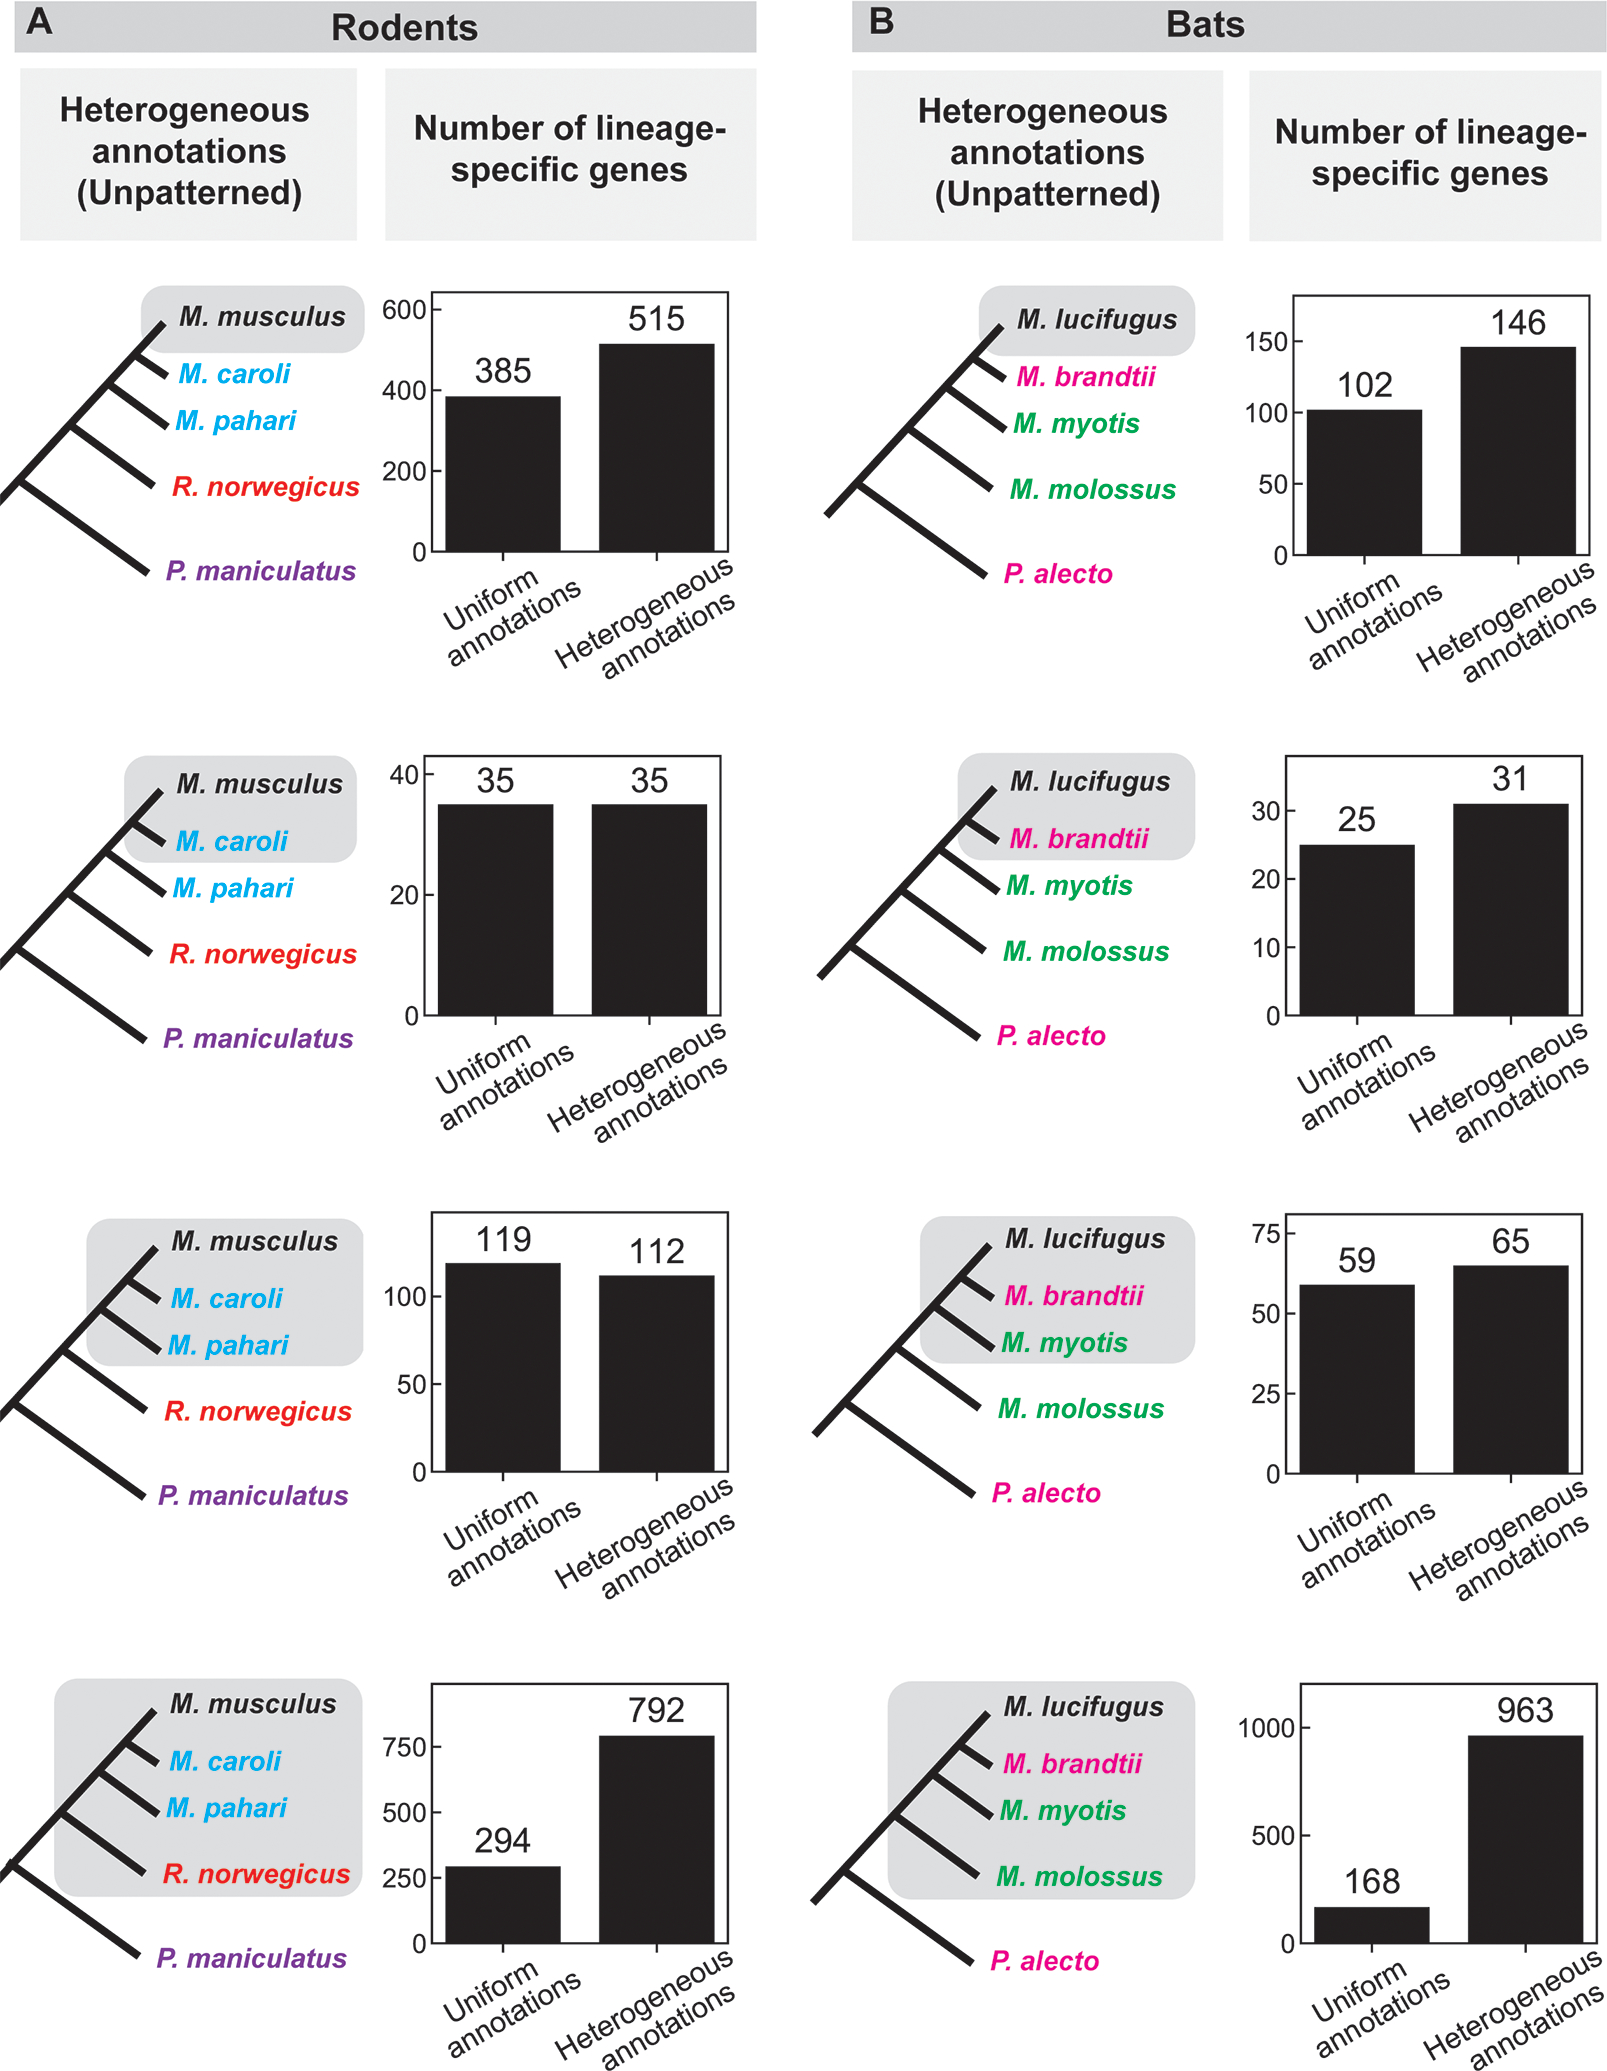
Figure 3: Comparison of the number of lineage-specific genes found using uniform and heterogeneous (unpatterned) annotations in a) rodents and b) bats.

The species tree on the left indicates the lineage under consideration (grey shading); different text colors indicate different annotation sources in the heterogeneous annotation analysis (black, NCBI; blue, UCSC; red, Ensembl “mixed genebuild”; purple, Ensembl “full genebuild”; green, Bat1k; pink, Beijing Genomics Institute; see also Supplemental Table 3, 4). A depiction of the uniform annotation pattern, in which all annotations are from NCBI (black), is not shown. Bar graphs indicate the number of genes that appear specific to the lineage shaded on the species tree to the left using either uniform or heterogeneous annotations. See also Supplemental Table 5 for results of tBLASTx searches in this group.
