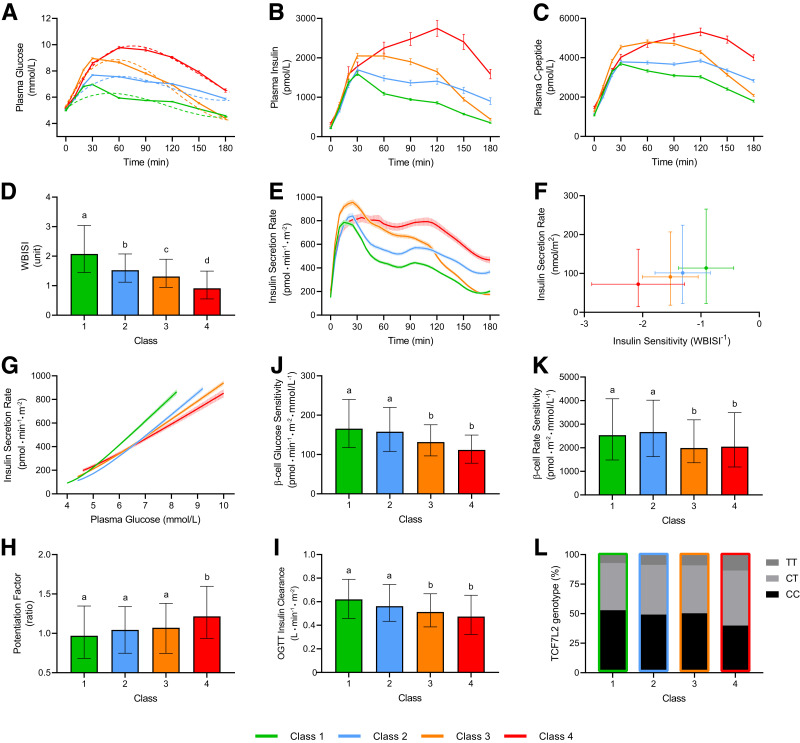
Figure 1.
Observed (solid lines) and predicted (dashed lines) glucose profiles (A), plasma insulin (B), and C-peptide (C) profiles; WBISI (D), insulin secretion rate profile (E), total insulin secretion as a function of insulin sensitivity (F), and achieved plasma glucose levels (G); β-cell glucose sensitivity (H), rate sensitivity (I), and potentiation (J); total insulin clearance (K); and prevalence of the T risk allele for the common TCF7L2 variant rs7903146 (L) in the four latent classes of glucose response patterns identified. Data are mean ± SEM (A–C, E, G) or median (IQR) (D, F, H–L). Different letters between groups indicate statistically significant differences (P < 0.05).

