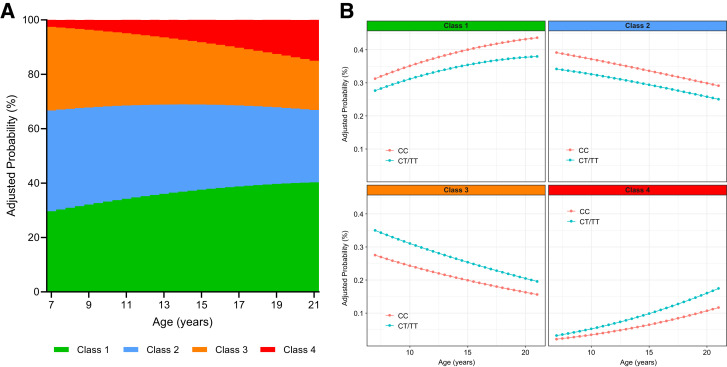
Figure 2.
Model-predicted cumulative probability (risk) to be assigned to each of the four identified latent glucose pattern classes across ages in the longitudinal cohort (A) and in the subgroups of participants carrying the CT/TT or CC genotype (B). Probabilities are adjusted for sex and race/ethnicity.

