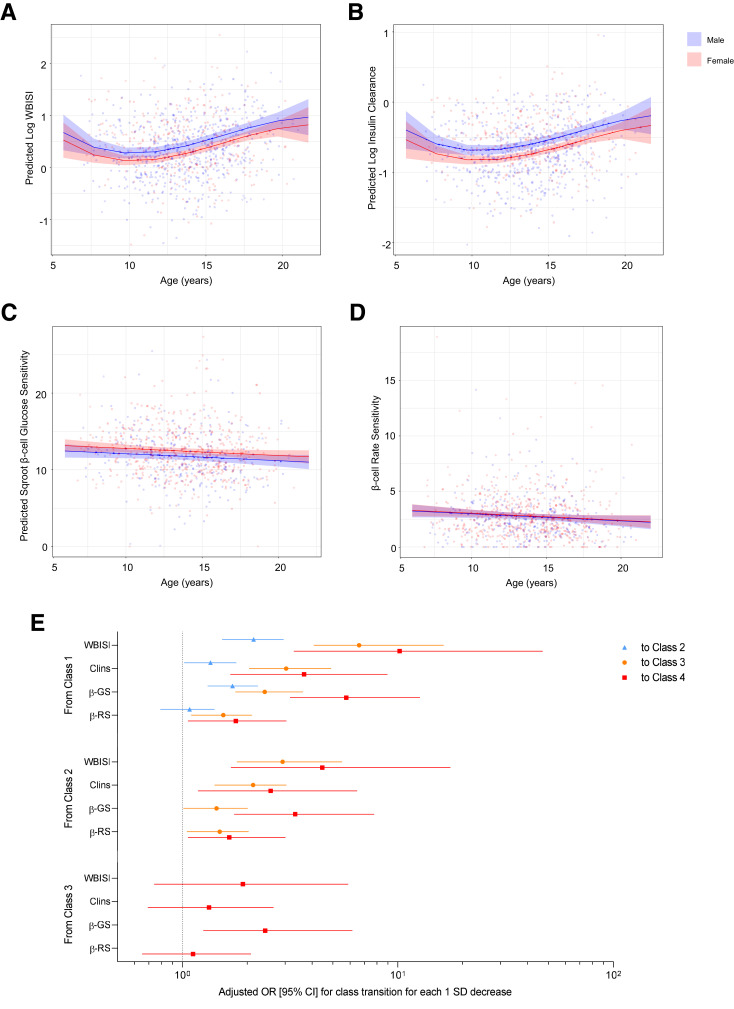
Figure 3.
Longitudinal changes in insulin sensitivity (WBISI) (A), insulin clearance (Clins) (B), β-cell glucose sensitivity (β-GS) (C), and β-cell rate sensitivity (β-RS) (D) across ages in males and females, adjusted for race/ethnicity and BMI. Odds ratios (95% CIs) for the transition from lower to higher latent glucose pattern classes for each 1-SD decrease in WBISI, Clins, β-GS, and β-RS adjusted for sex and race/ethnicity (E). Sqroot, square root.

