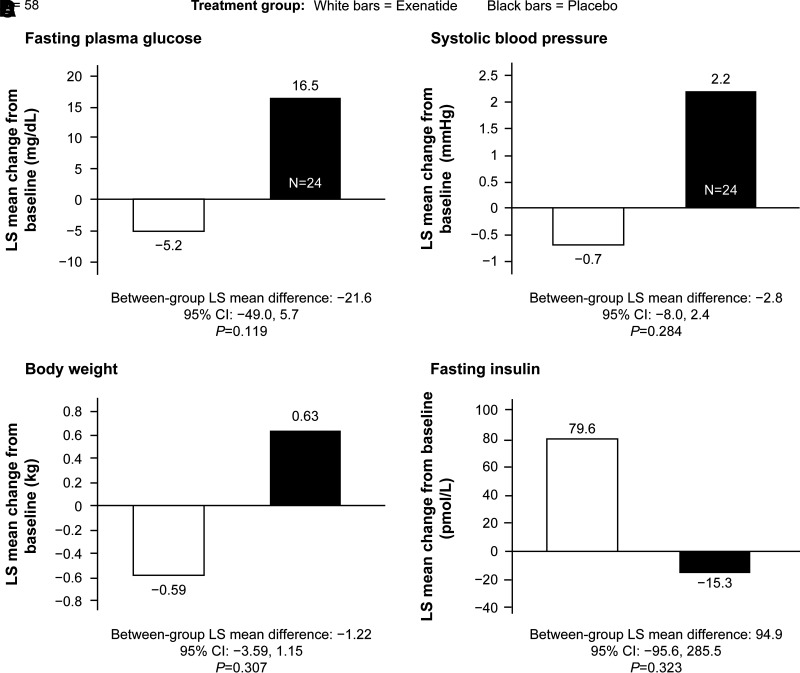
Figure 2.
Changes in fasting plasma glucose (A), body weight (B), systolic blood pressure (C), and fasting insulin (D) from baseline to week 24 with use of a mixed model with repeated measures analysis (least squares [LS] mean). Adjusted LS mean and treatment group difference in the change from baseline at week 24 were modeled with use of a mixed model with repeated measures including treatment group, region, screening glycated hemoglobin category, visit, treatment group–by–visit interaction, baseline level, and baseline level–by–visit interaction as fixed effects, with an unstructured covariance matrix. Baseline was defined as the last nonmissing assessment (scheduled or unscheduled) on or prior to the first dose of the randomized study medication. Data collected after the initiation of rescue medication or after premature discontinuation of the study medication were excluded. N, number of participants in the evaluable analysis set within the treatment group.

