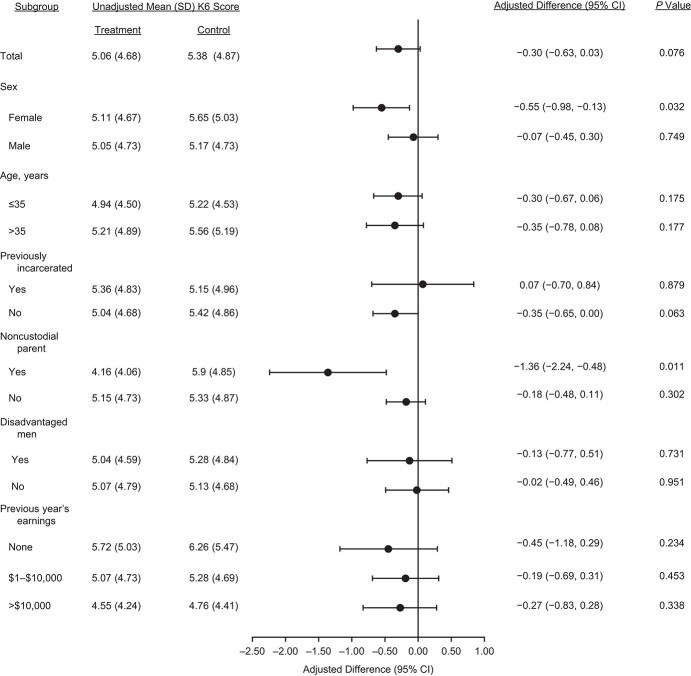
Figure 3.
Results of subgroup analyses comparing receipt of the Paycheck Plus intervention (treatment group) with the existing Earned Income Tax Credit (control group), Paycheck Plus Health Study, 2013–2016. Bars, 95% confidence intervals (CIs). K6, 6-item Kessler Psychological Distress Scale; SD, standard deviation.

