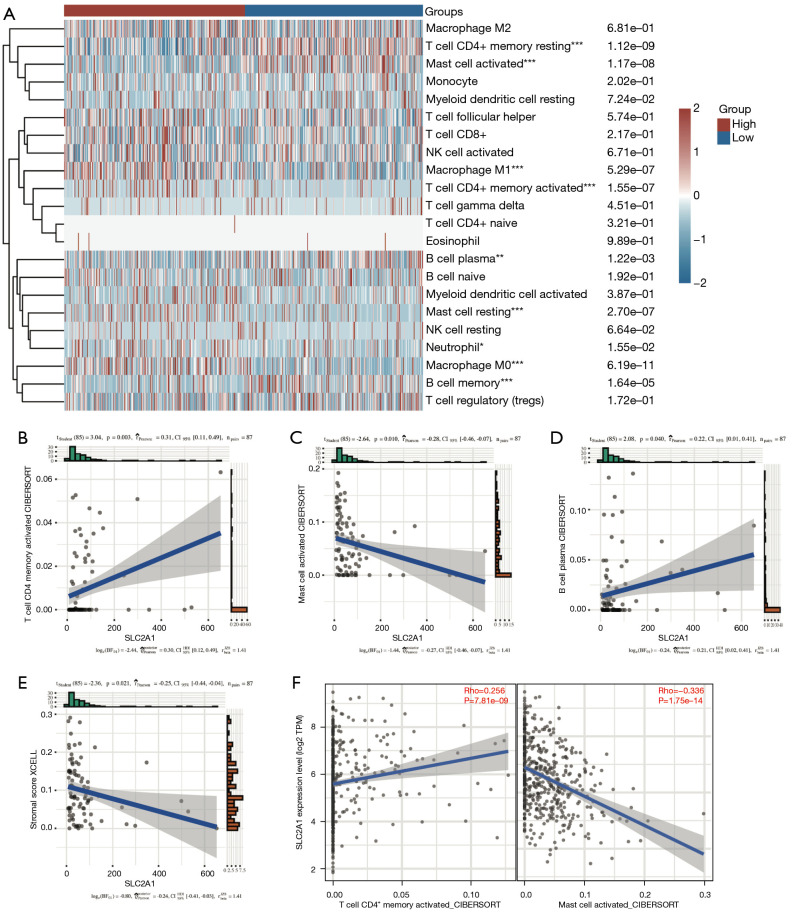
Figure 7.
Relationship between SLC2A1 and tumor-infiltrating immune cells. (A) Immune infiltration analysis using CIBERSORT revealed significant differences in the infiltration of nine types of immune cells between the high and low SLC2A1 expression groups in TCGA; (B-D) three of the above nine tumor-infiltrating immune cells also exhibited a significant correlation with SLC2A1 in the GEO data, but the correlation trend of plasma B cells was contrary to that of the previous analysis; (E) SLC2A1 expression was negatively correlated with the stromal score in TIMER; (F) the correlation between SLC2A1 and the two cells in TCGA data was evaluated using TIMER2.0, and the results were the identical to those of the GEO. *, P<0.05; **, P<0.01; ***, P<0.001. TCGA, The Cancer Genome Atlas; GEO, Gene Expression Omnibus.

