
Figure 5.
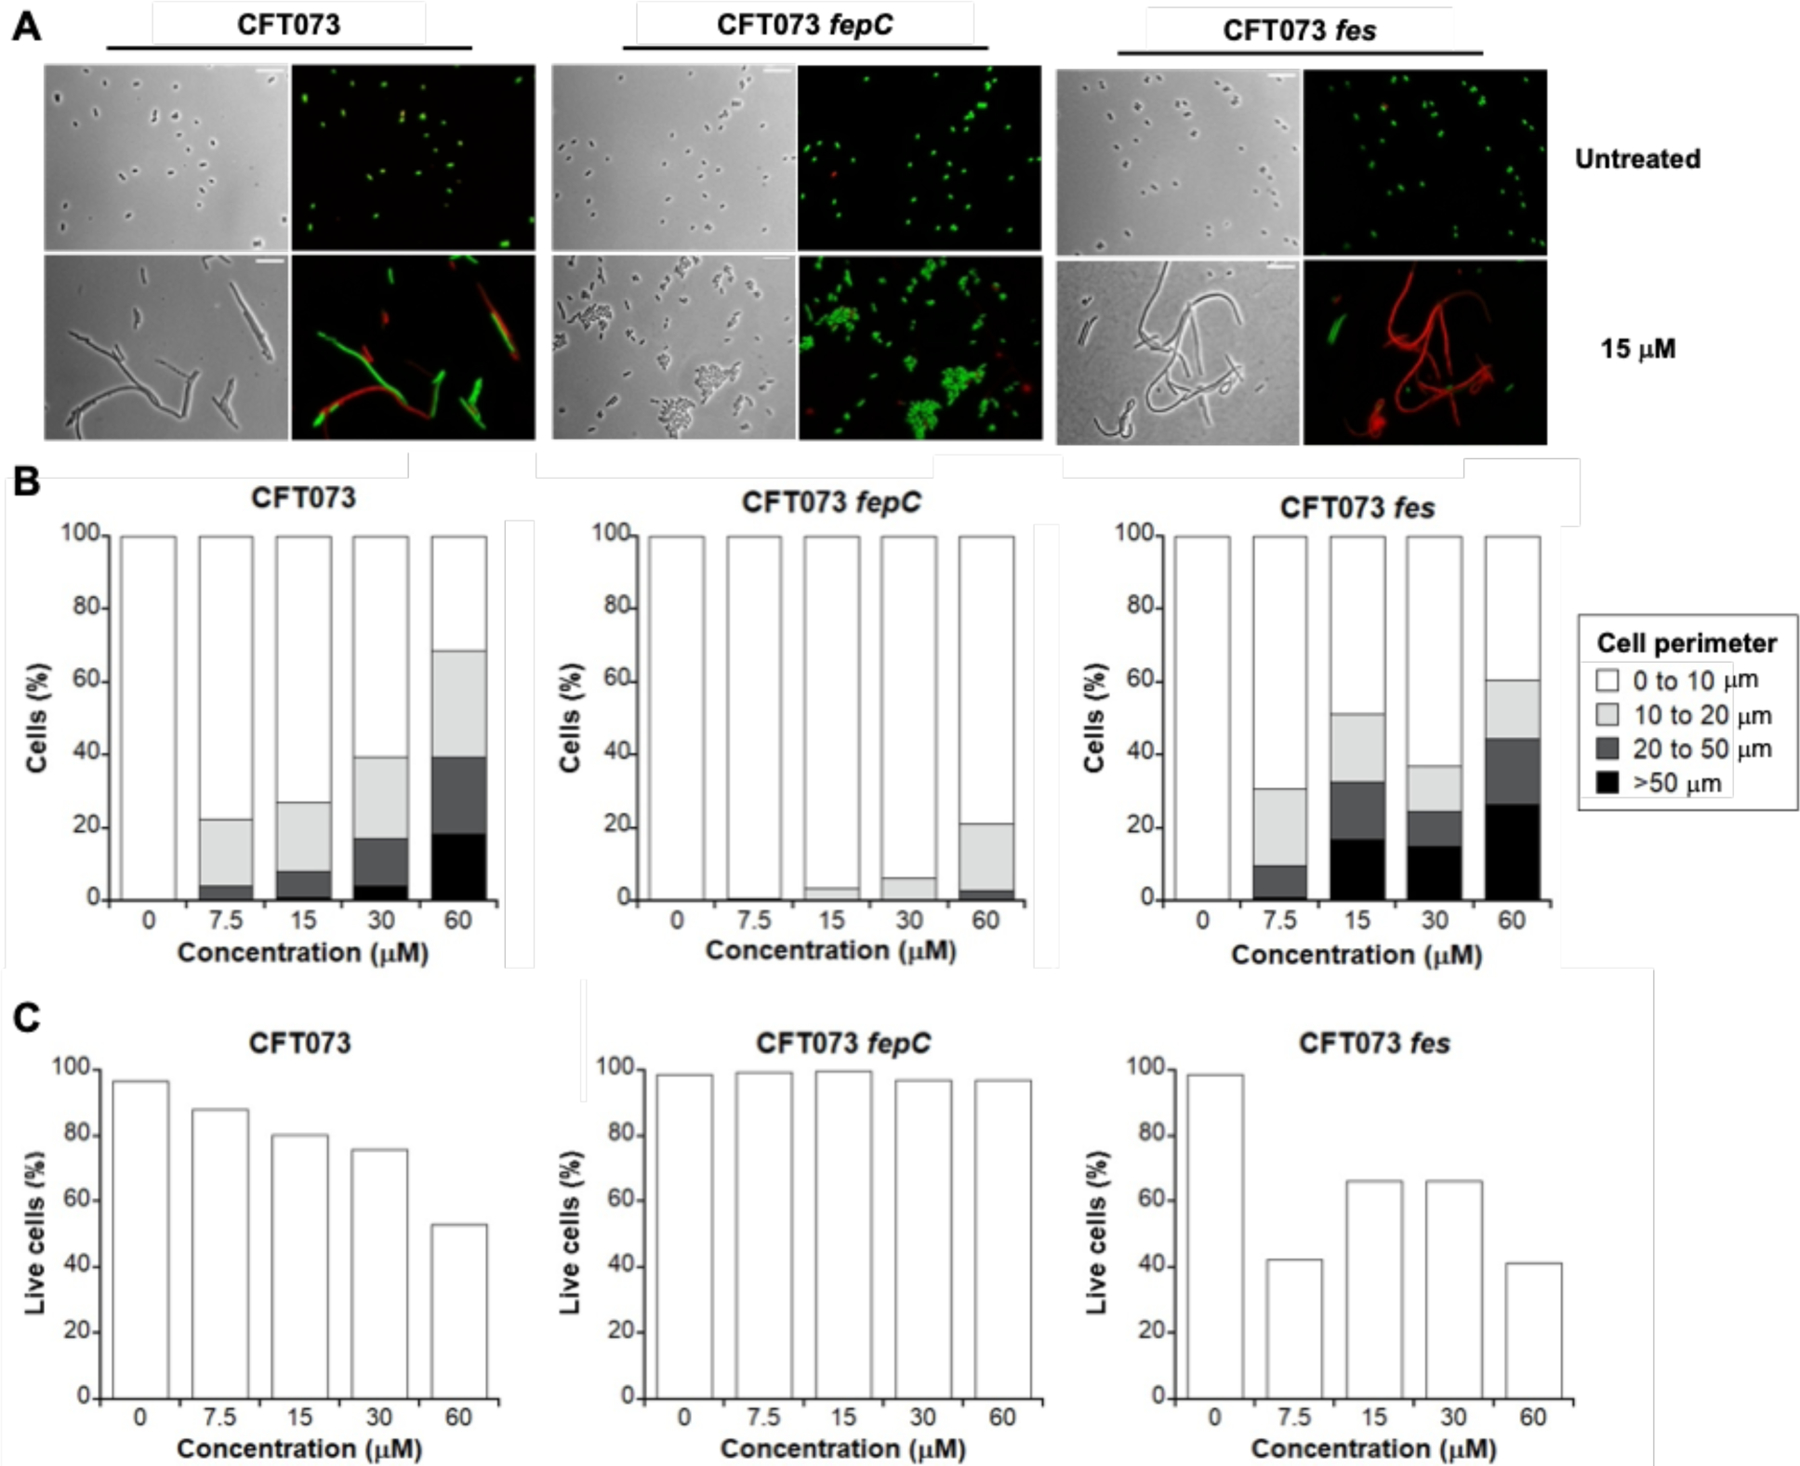
Activity of l-EP against E. coli CFT073 and the fepC and fes mutants. (A) Representative phase-contrast and fluorescence micrographs of E. coli CFT073, its inner membrane transporter mutant fepC, and its cytoplasmic esterase mutant fes treated with 15 µM l-EP in modified M9 medium for 11 h at 30 °C. Scale bar: 10 mm. (B) Quantification of the l-EP-induced bacterial morphologies in E. coli. (C) Viability of E. coli determined by LIVE/DEAD staining. For morphology and viability quantification, 500–1000 cells were manually counted for each condition from micrographs. For morphology quantification, cell size was measured and grouped by perimeter. Activity of l-EP against the inner membrane transporter mutant fepDG and the cytoplasmic esterase mutant iroD are shown in Figure S14.