Fig. 1.
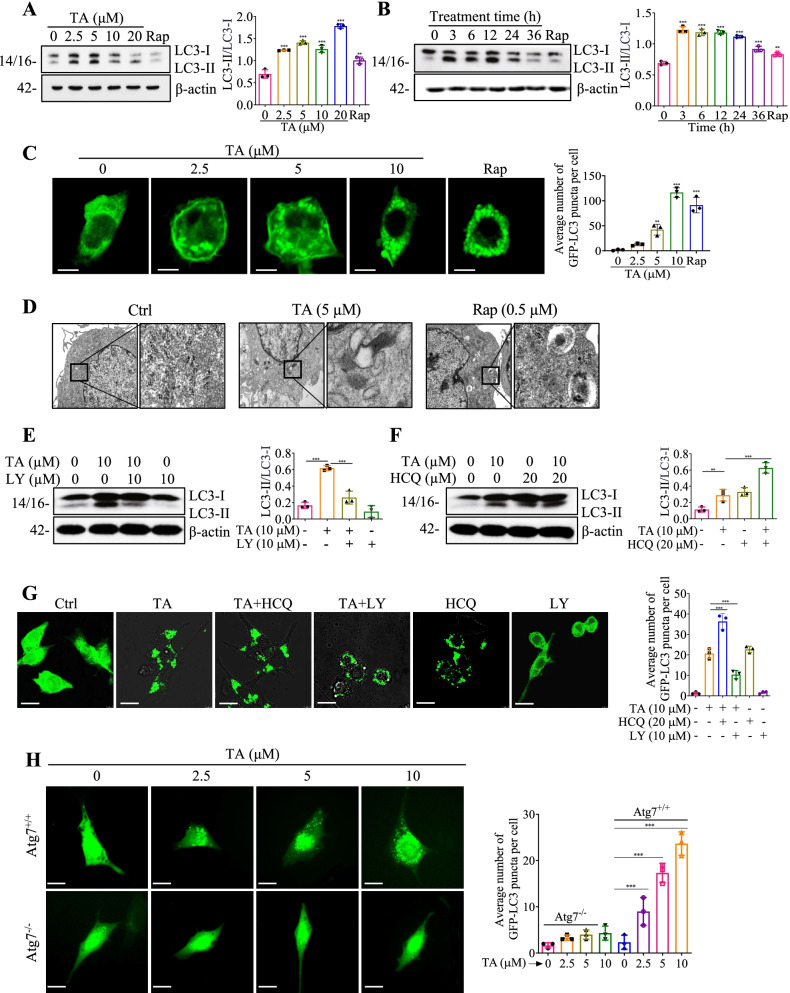
TA induces autophagy flux in microglial cells. A, B LC3 expressions of BV-2 cells treated with the indicated concentration of TA for 24 h or treated with 10 μM of TA for the indicated hours, and 0.5 μM rapamycin (Rap) was set as a positive autophagy inducer. Bar charts indicate the ratios of LC3-II/LC3-I. C Representative fluorescence images of mouse primary microglial cells transfected with GFP-LC3 plasmid and treated with TA or Rap for 24 h were captured. Magnification, × 63; scale bar: 25 μm. D Representative electron micrographs showing the ultrastructures of BV-2 cells which were treated with TA (5 μM), or Rap (0.5 μM) for 24 h. Left: Magnification: × 10000, scale bar: 2 μm; Right: Magnification: × 250000, scale bar: 500 nm. E, F LC3 expressions of BV-2 cells were pretreated with LY (10 μM) or HCQ (20 μM) for 1 h, followed by treatment with TA (10 μM) for an additional 24 h. Bar charts indicate the ratios of LC3-II/LC3-I in BV-2 cells. G Representative fluorescence images of BV-2 cells transfected with GFP-LC3 plasmid and pretreated with LY (10 μM) or HCQ (20 μM) for 1 h, followed by treatment with TA (10 μM) for an additional 24 h. Magnification, × 40; scale bar: 50 μm. The bar chart represents the average number of GFP-LC3 puncta per cell. H Representative fluorescence images of Atg7+/+ and Atg7−/− MEF cells transfected with GFP-LC3 plasmid and treated with 2.5, 5, and 10 μM of TA for 24 h were captured. Magnification, × 40; scale bar: 50 μm. The bar chart represents the average number of GFP-LC3 puncta per cell. Error bars, S.D. *p ≤ 0.05; **p ≤ 0.01; ***p ≤ 0.001, n = 3. (One-way ANOVA with Tukey-corrected post hoc t-test for multiple comparisons was applied for comparison between groups). The full-length blots are presented in Additional file 1: Fig. S19

