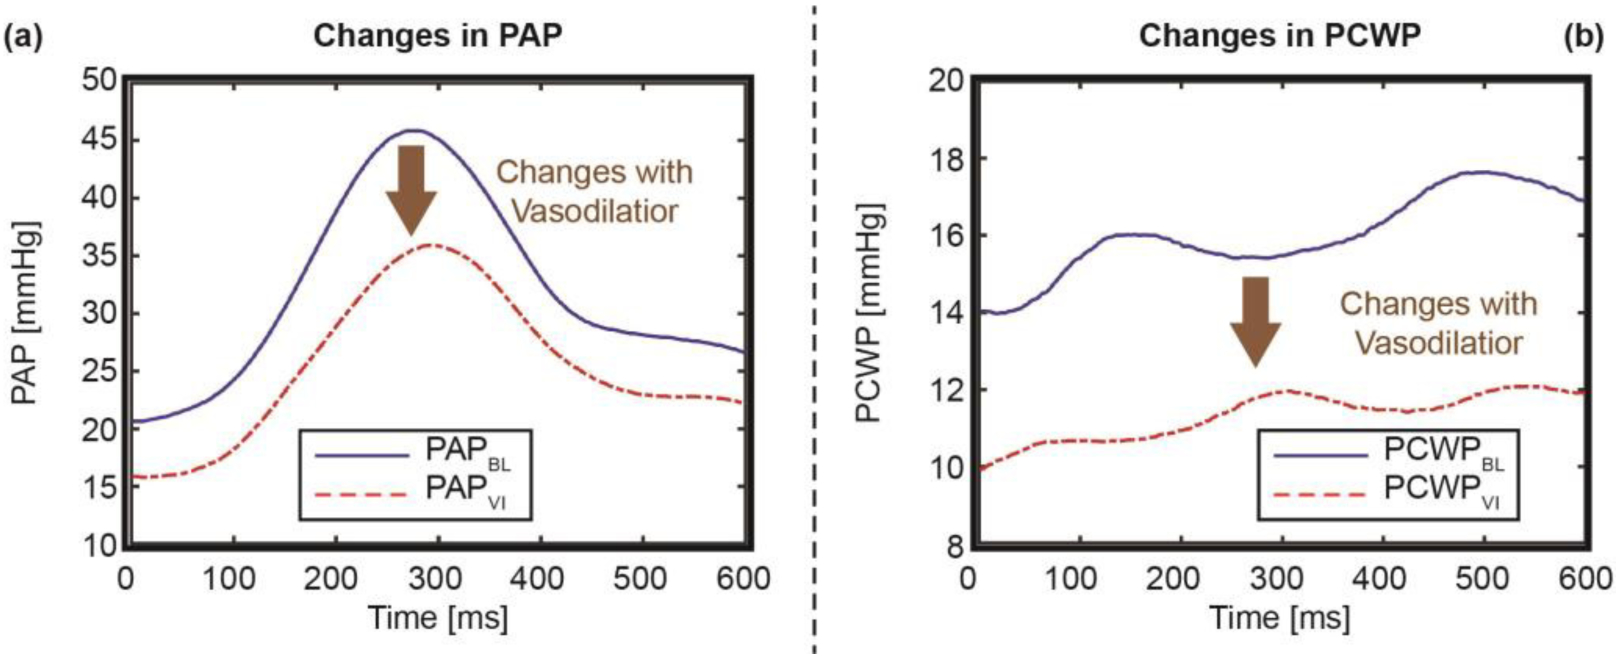
Fig. 3.

Changes in (a) pulmonary artery pressure (PAP) and (b) pulmonary capillary wedge pressure (PCWP), with the infusion of vasodilator for a representative subject, with brown arrows showing the changes in the respective signals. Time “0” indicates the location of the corresponding ECG R-peak.
