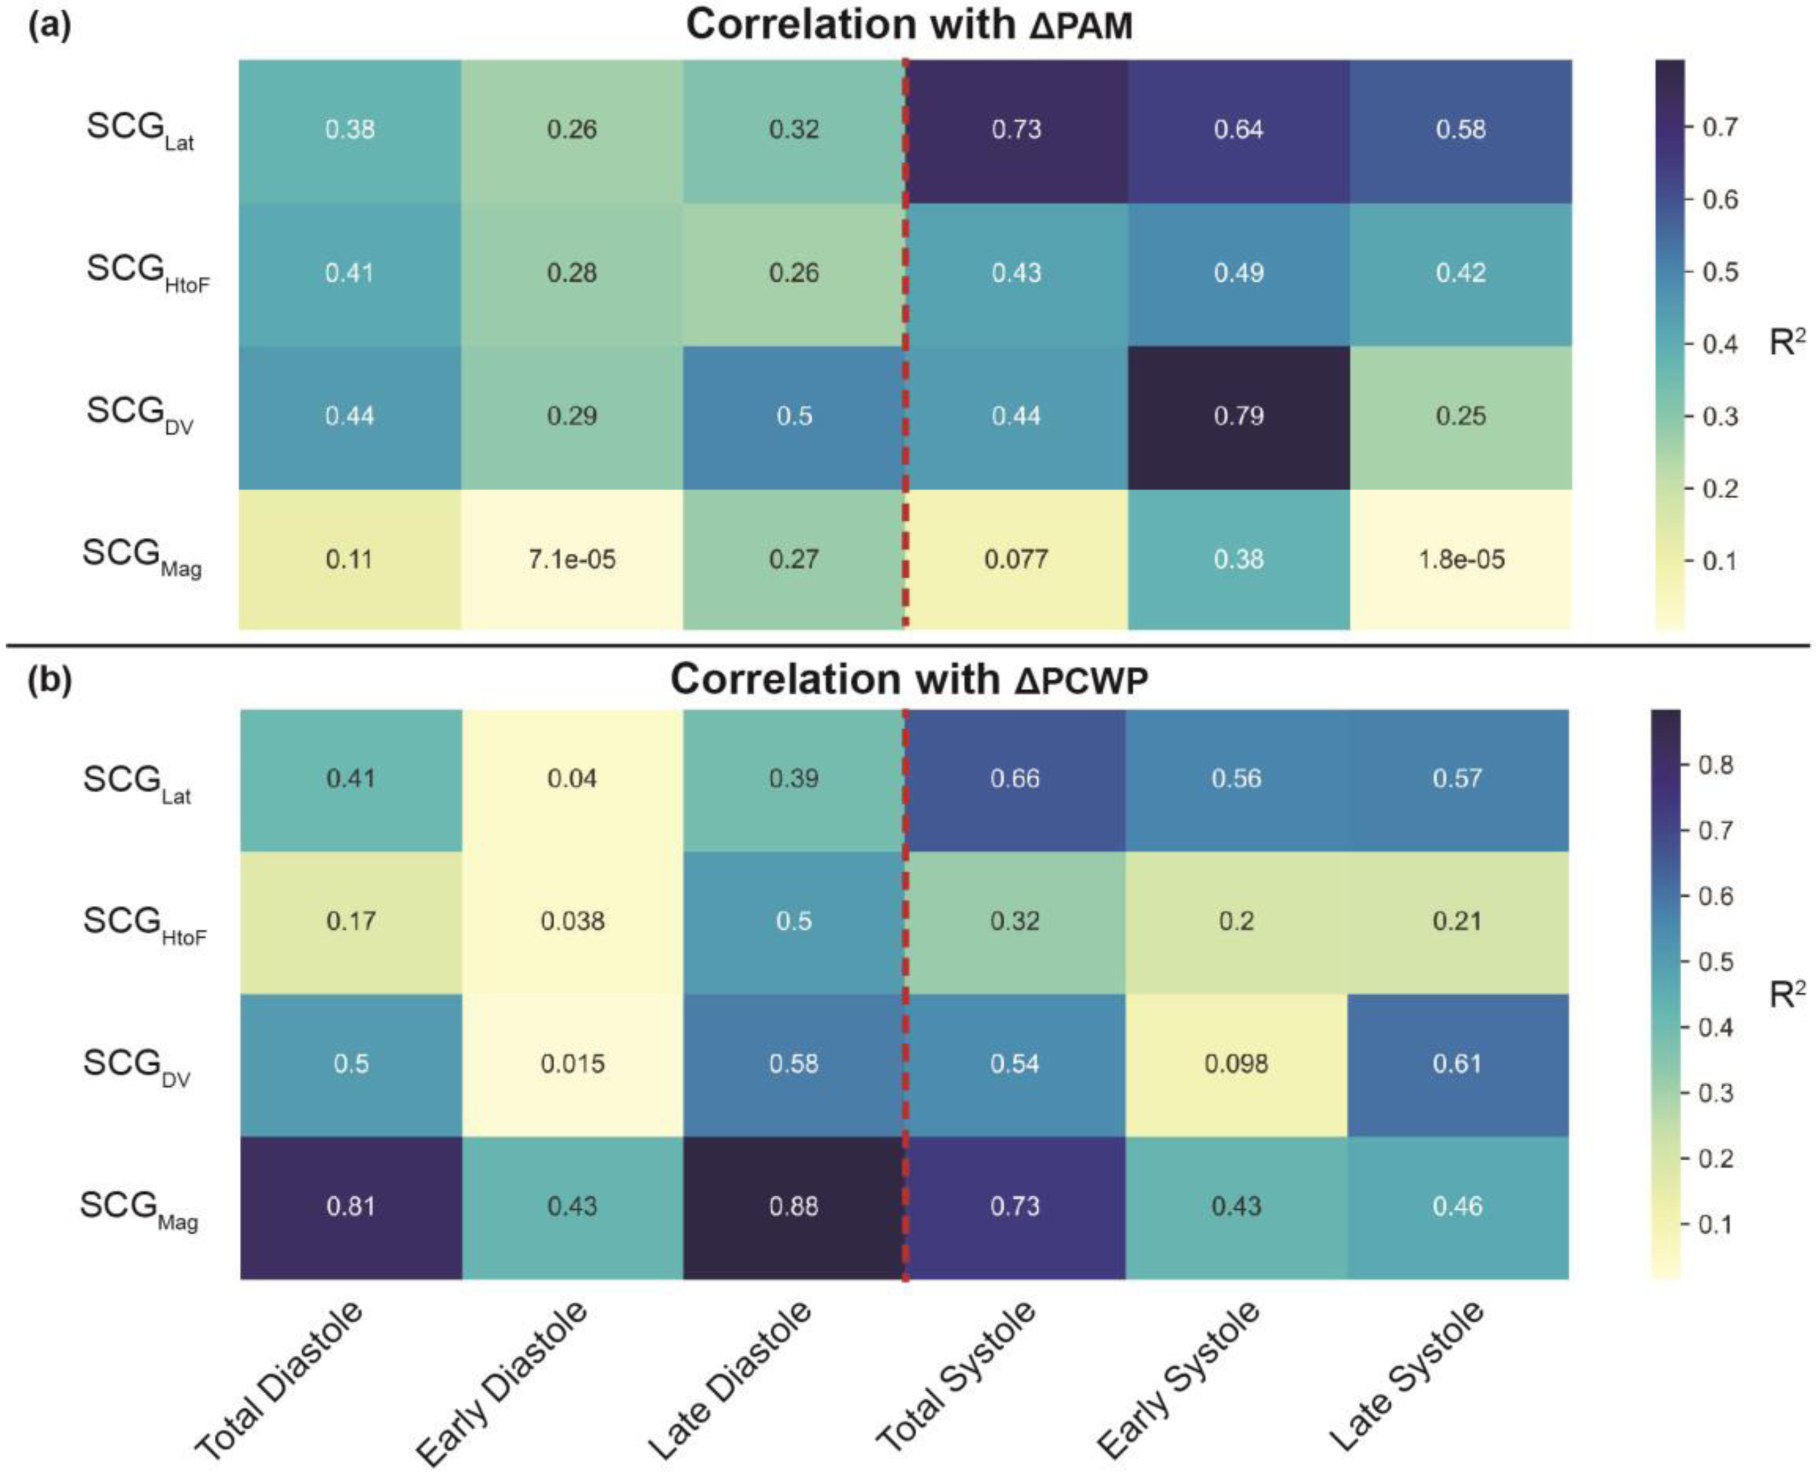
Fig. 5.

Correlation analysis of the target variable (a) ΔPAM and (b) ΔPCWP with different DTW distances of corresponding SCG signals for the training-testing set, with the colorbar showing the R2 values and the red dotted line indicating the division between ventricular diastole and systole (i.e., R-peak of corresponding ECG). Total Diastole (−500ms : R-peak), early diastole (−500ms : −200 ms), late diastole (−200ms : R-peak), total systole (R-peak : 500ms), early systole (25ms : 150ms), and late systole (200ms : 500ms).
