
Fig. 7.
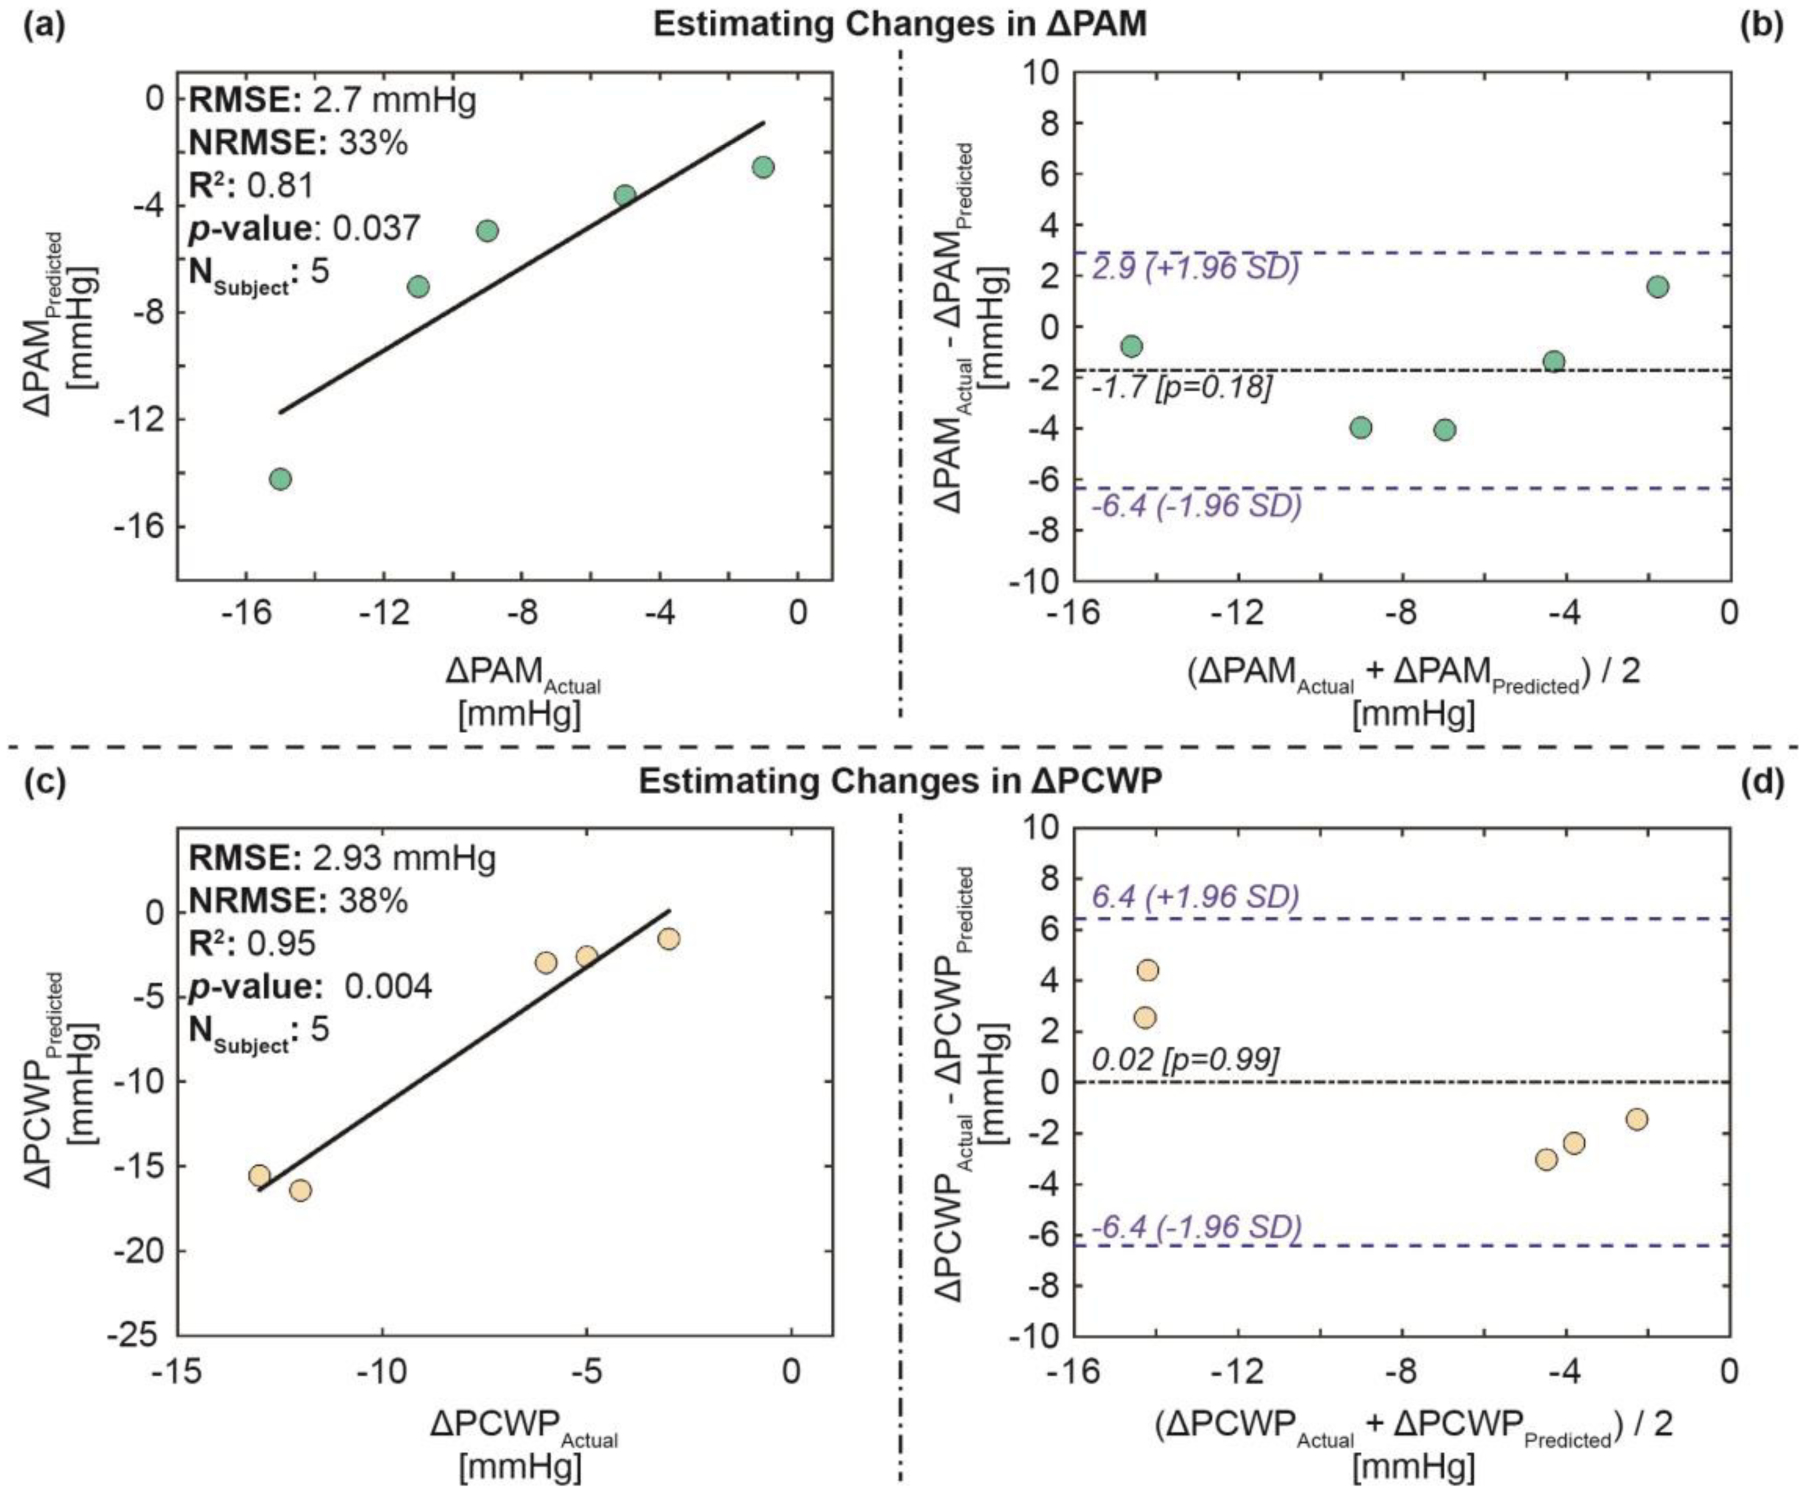
Estimation results for the validation set: (a) Correlation analysis for ΔPAM predicted vs. ΔPAM actual, (b) Bland-Altman analysis for ΔPAM predicted and ΔPAM actual, (c) correlation analysis for ΔPCWP predicted vs. ΔPCWP actual, and (d) Bland-Altman analysis for ΔPCWP predicted and ΔPCWP actual. In the Bland-Altman plots, the black line indicates the mean, while the blue dashed lines indicate mean ± 1.96 × standard deviation (SD).