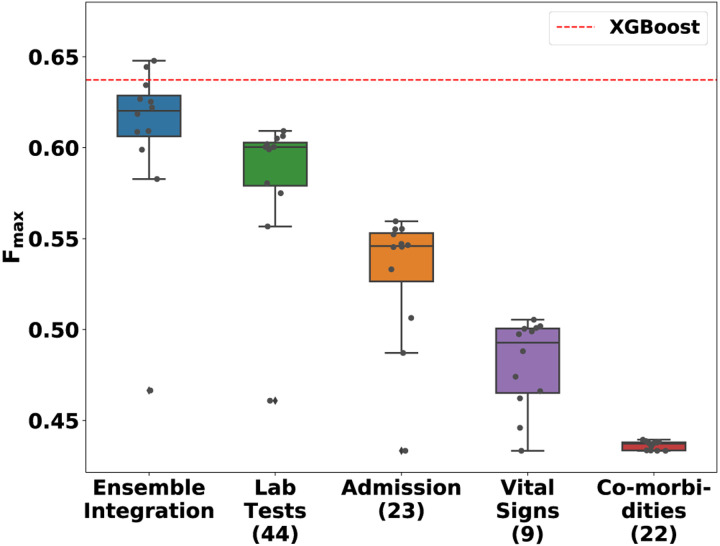
Fig. 5: The distribution of Fmax values of various ensemble models and XGBoost for predicting mortality from COVID-19 over a patient’s hospitalization.
The performance distributions of Ensemble Integration (EI) and the heterogeneous ensembles derived from the individual EHR data modalities are shown as box-and-whisker plots. Each plot includes eleven ensemble models built using mean aggregation, CES, and nine stacking algorithms. The numbers in parentheses next to the names on the x-axis indicate the number of features in the corresponding modality. The dotted red line indicates the performance of the XGBoost model trained after concatenating the feature vectors in each individual modality.

