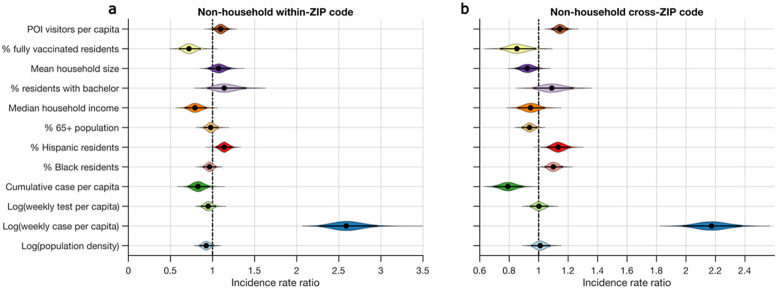
Figure 4.
Effects of various features on the transmission of SARS-CoV-2 in NYC. Incidence rate ratios (exponentiated coefficients) for non-household within-ZIP code transmission and cross-ZIP code transmission are shown for 12 covariates in (a) and (b), respectively (Deviance information criterion, DIC=6,342 for a and DIC=12,644 for b). Coefficients were estimated using a Poisson generalized linear mixed model controlling for spatial-temporal autocorrelations. We used the log-transformed population as the offset in the regression model. Covariates were standardized and are shown on the y-axis. The incidence rate ratio quantifies the multiplicative change in the number of transmission events per each covariate increase of one standard deviation, controlling for other covariates. The violin plots show the distributions of incidence rate ratios. Black dots and horizontal black lines highlight the median estimates and 95% CIs.

