FIG. 2.
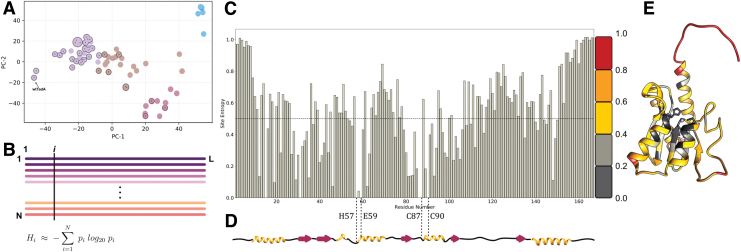
(A) The top two principal components of the pairwise sequence distance matrix of extant homologs comprising the filtered (indicated with circles and dots) and unfiltered data sets. Based on the similarity of the sequences, the data set is clustered into four separate sets, colored purple, brown, red, and blue. The sequences in the filtered data set are highlighted in each cluster. (B) Multiple sequence alignment of extant homologs of wtTadA to calculate the statistical probability of occurrence of individual amino acids at residue site i . This is subsequently used to assign a conservation score to site i, using Shannon's definition of information entropy equation 1. (C) Information entropy of individual residue sites of the wtTadA query, with its secondary structure elements mapped below in (D). I Entropy values mapped on to the three-dimensional structure of E. coli TadA using a color gradient to signify conserved residues and mutational hotspots. Color images are available online.

