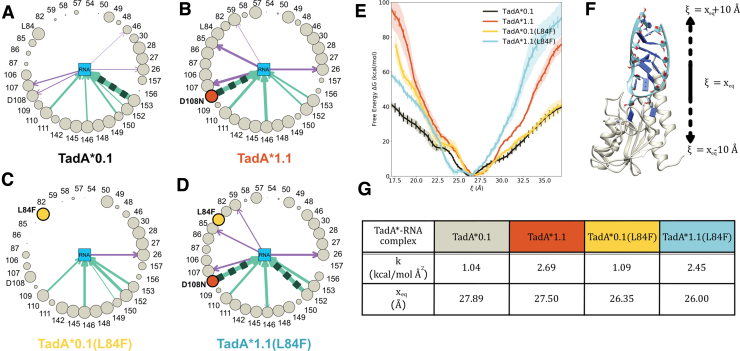
FIG. 5.
Asteroid plots for the analysis of the interaction of (A) TadA*0.1, (B) TadA*1.1, (C) TadA*0.1(L84F), and (D) TadA*1.1(L84F) with substrate RNA. I Binding affinity comparisons for the various TadA*–RNA complexes. (F) The collective variable (ξ) used to monitor the binding/unbinding of the TadA*–RNA complexes. (G) Parameters associated to harmonic functions fitted to binding energy curves shown in I. Color images are available online.

