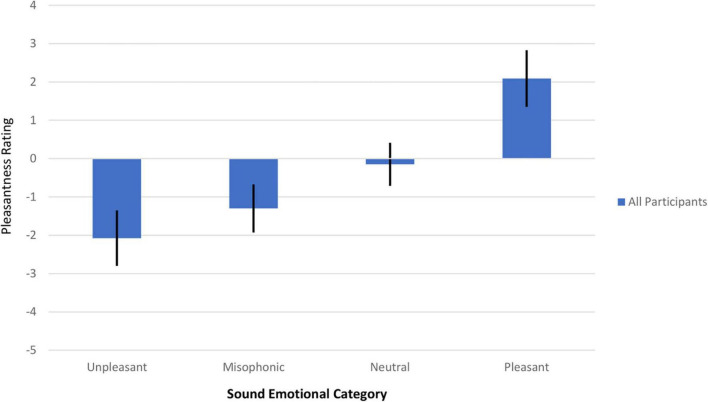
FIGURE 1.
Mean pleasantness rating versus the sound emotional category for all participants in Experiment 1. A 95% confidence interval (t-test) is shown, represented by a thick black line. All four emotional categories are shown, in ascending order of average pleasantness (unpleasant, misophonic, neutral, and pleasant).

