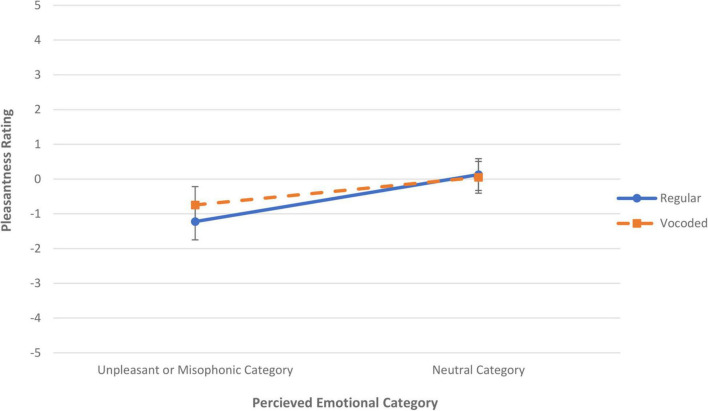
FIGURE 2.
Mean pleasantness rating versus the perceived emotional category for both regular, non-vocoded sounds (solid blue line) and vocoded sounds (dashed orange line). Ratings of sounds misidentified within the same emotional category were subaveraged. The error bars denote standard error of the mean rating across sounds. If the sound was identified (regardless of correctness) as an item in one of our a priori negative categories (either a misophonic or unpleasant sound) then it contributed to a data point on the left, whereas if the sound was identified as an item in our neutral category (regardless of correctness), contributed to a data point on the right.

