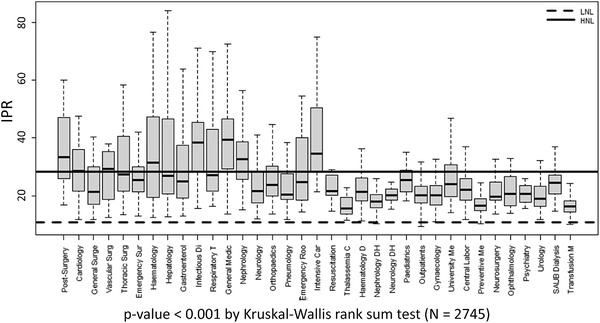
FIGURE 1.

Distribution of IPR means per every department. Significantly high IPR values have been detected in patients located in the COVID‐19 wards compared to non‐COVID‐19 wards (27.26 [20.66–38.92] vs. 19.01 [16.10–22.83], respectively). LNL, lower normal limit (10.7%); HNL, higher normal limit (28.3%)
