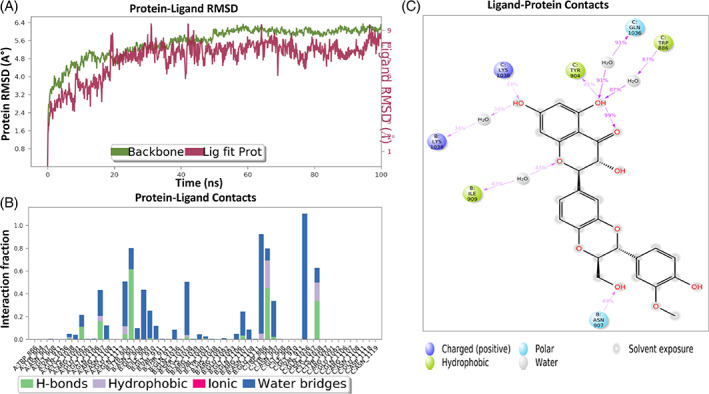
FIGURE 13.

Interaction diagram of silibinin with S protein observed during the molecular dynamic simulation. (a) Protein‐ligand interaction diagram. (b) Silibinin in contact with S protein. (c) Schematic diagram of silibinin interaction with the amino acid residues of S protein during MDs
