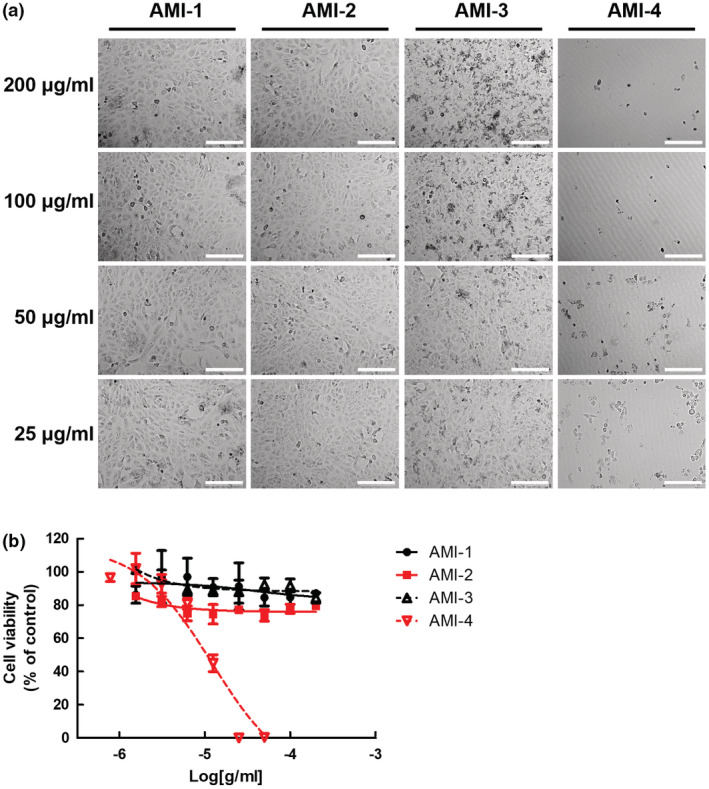
FIGURE 2.

Cytotoxicity of chitosan‐based substances on cultured cells. (a) Morphology of chitosan‐based substances and ivermectin treated cells. Phase‐contrast microscopy images were obtained from Vero E6 cells treated with indicated concentrations (25–200 μg/ml) of AMI‐1 to −4 for 24 h. Representative single optical sections are shown. Scale bars, 200 μm. (b) Measurement of cytotoxicity of cells treated with chitosan‐based substances and ivermectin. MTT assay of Vero E6 cells treated with indicated concentration (25–200 μg/ml) of AMI‐1 to −4 for 24 h. Data are represented as mean ± SD.
