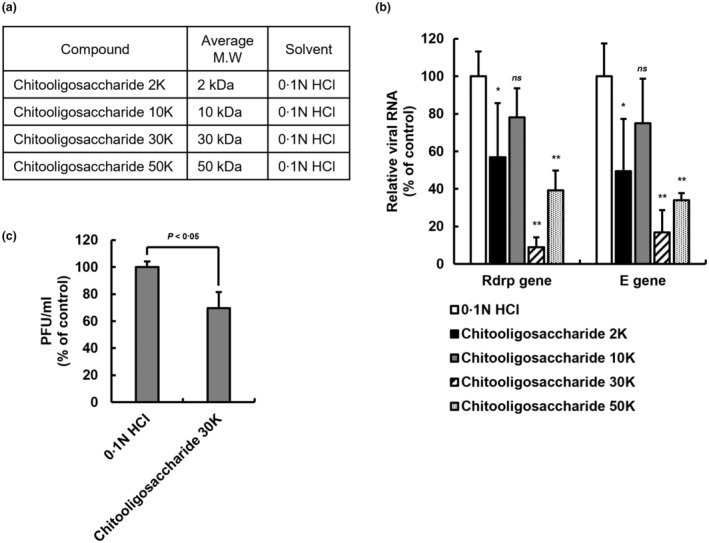
FIGURE 5.

Antiviral effect of chitooligosaccharides of various molecular weights on SARS‐CoV‐2. (a) The chitooligosaccharides of various molecular weights. Separation by molecular weight to confirm the inhibitory effect of chitooligosaccharide on SARS‐CoV‐2 virus replication. (b) Antiviral effect of chitooligosaccharides on SARS‐CoV‐2 through qPCR analysis. The amount of SARS‐CoV‐2 virus at MOI 0.01 was incubated with 25 μg/ml of chitooligosaccharides (2, 10, 30 and 50 kDa) for 1 h at room temperature, infected with Vero E6 cells, and incubated with the chitooligosaccharides for 48 h. Viral RNA was extracted from the culture medium of the cells, and the SARS‐CoV‐2 gene was detected through qPCR analysis. The graph of relative viral RNA was represented to RdRP gene and E gene of SARS‐CoV‐2. Data are represented as mean ± SD (n = 5, ns. not significant, *p < 0.05, **p < 0.001, two‐way ANOVA). (c) Plaque assay of SARS‐CoV‐2 infected Vero E6 cells. After 1 h of the virus within 200 μg/ml of chitooligosaccharide 30 kDa adsorption, low‐melting agar containing overlays were added. After 3 days, the cells were fixed and stained with crystal violet. The plaque forming unit is calculated by plaque number counting. Data are represented as mean ± SD (n = 3, p < 0.05, Student's t test).
