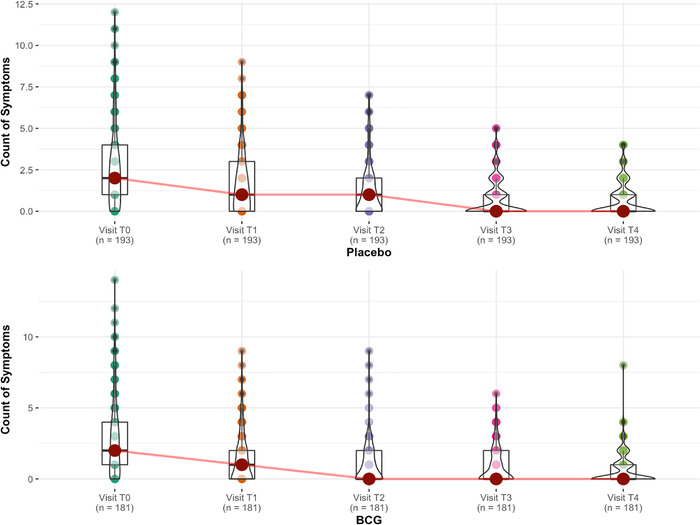
Fig. 2.

Symptomatic analysis of patients. Each symptom is given a number, and the count of symptoms for each patient for each visit is calculated to understand the difference in speed of recovery. For example, if the patient had headache and fatigue on visit T1, the symptom count on T1 would be 2. The graphs show no significant difference between Bacillus Calmette–Guérin (BCG) and placebo on recovery speed except for visit T2 when BCG recipients are slightly less symptomatic.
