Figure 1.

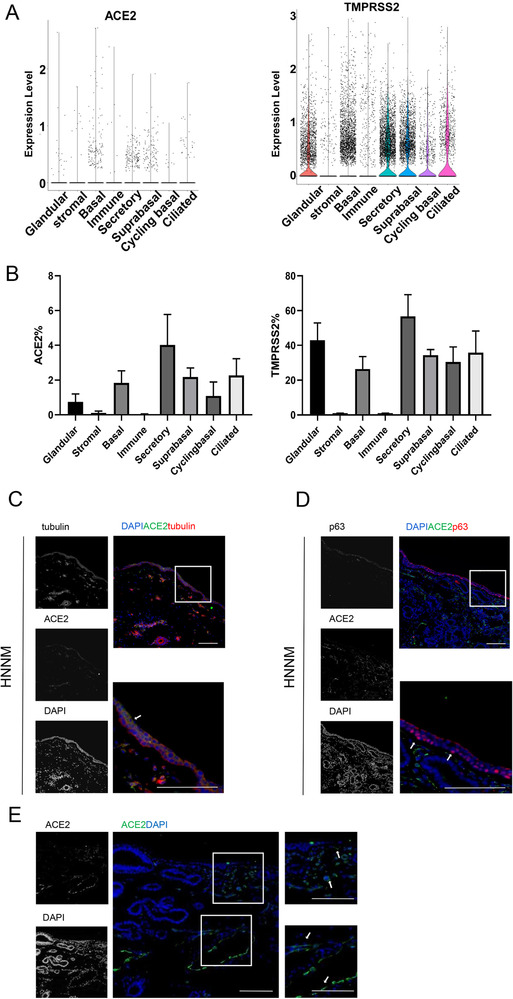
ACE2 expression pattern in human normal nasal mucosa tissues (HNNM). (A) ACE2 and TRPPSS expression across major cell types in HNNM. (B) Proportions of cells expressing ACE2 and/or TMPRSS2 across major cell types. Data are shown as mean ± SD and are pooled (n = 3) from three different samples. (C–D) ACE2 (green) expression in epithelial layer. (C) ACE2 (green) expression in tubulin+ cells (red) (including secretory cells, glandular cells, and ciliated cells). White arrows denote tubulin+ cells. (D) ACE2 (green) expression in p63+ basal cells (red). White arrows denote p63+ cells. (E) ACE2 (green) expression outside the epithelial layer. White arrows denote ACE2+ cells around blood vessels. (C‐E) One representative image from ten (C and E) or eight (D) independent samples is shown. Scale bar = 100 μm.
