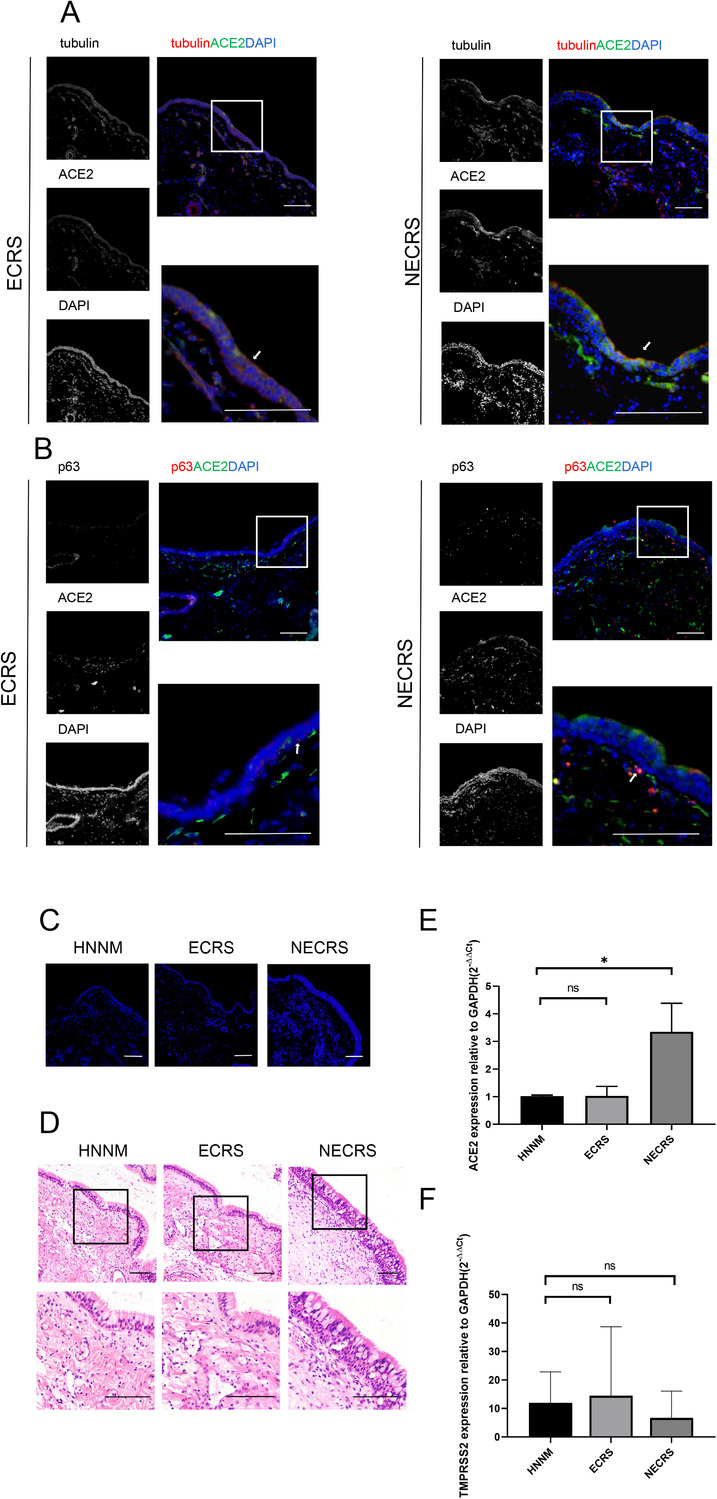
Figure 2.

ACE2 expression dynamics in nasal mucosal tissues from patients with chronic rhinosinusitis (CRS). (A) ACE2 (green) expression in tubulin+ cells in both ECRS and NECRS tissues. (B) Expression of ACE2 (green) in p63+ basal cells (red). (C–D) DAPI and H&E staining show epithelial layers. (A–D) One representative image from five independent samples is shown for each type of tissues. Scale bar = 100 μm. (E–F) qRT‐PCR analysis show ACE2 expression (E) and TMPRSS2 expression (F) in NECRS group, control group, and ECRS group before infection. Data are shown as mean±SD of two to three samples for each type of the chronic sinusitis tissues and normal tissue. *p < 0.05; one‐way ANOVA.
