
Figure 4.
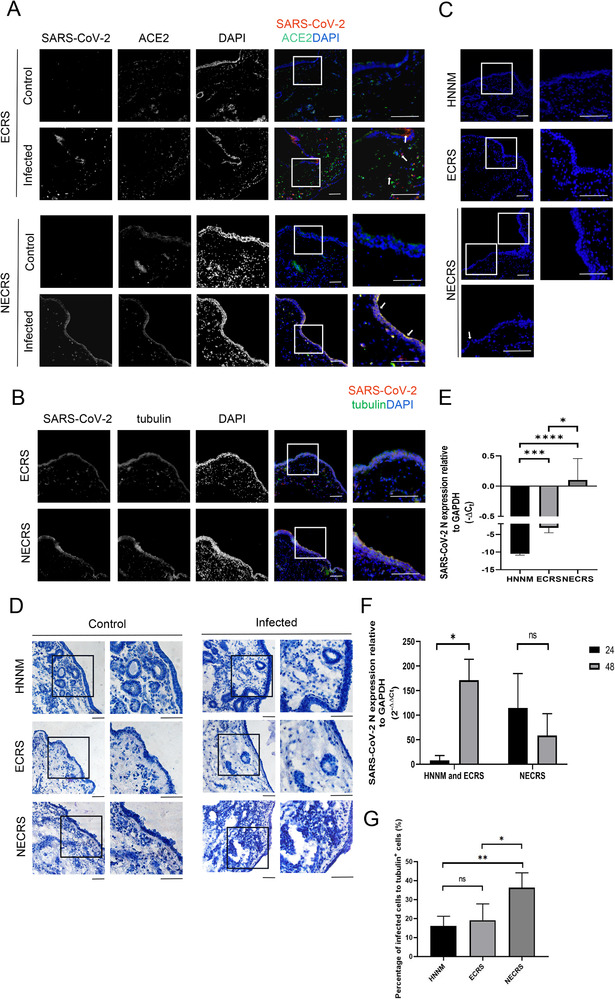
Increased susceptibility to SARS‐CoV‐2 in non‐ECRS (NECRS). (A) SARS‐CoV‐2 infection (red) in NECRS and ECRS nasal mucosal tissues. White arrows denote infected cells. (B) Viral infection (red) in tubulin+ cells (green). (C–D) DAPI and hematoxylin staining showing epithelial layer in NECRS after 24 h of infection. Some cavities visible within the infected NECRS nasal mucosal tissues in (D). (A–D) One representative image from a total of 30 (A–B) or 42 (C–D) independent samples (15 ECRS tissue samples, 15 NECRS tissue samples, and 12 healthy tissue samples) is shown for each group. Scale bar = 100 μm. (E) Viral susceptibility and production determined by qRT‐PCR at 24 h. (F) Comparation of viral infection and production at 24 and 48 h, as determined by qRT‐PCR. (E–F) Data are shown as mean ± SD of three to five group of samples from different patients for each type of the chronic sinusitis tissues and normal tissue.*p < 0.05,***p < 0.005,****p < 0.0005; one‐way ANOVA. (G) The percentage of infected cells to total cells according to immunofluorescence images (seven images of normal tissues, seven images of ECRS tissues, and seven images of NECRS tissues). Data are shown as mean ± SD. *p < 0.05, ***p < 0.005; one‐way ANOVA.