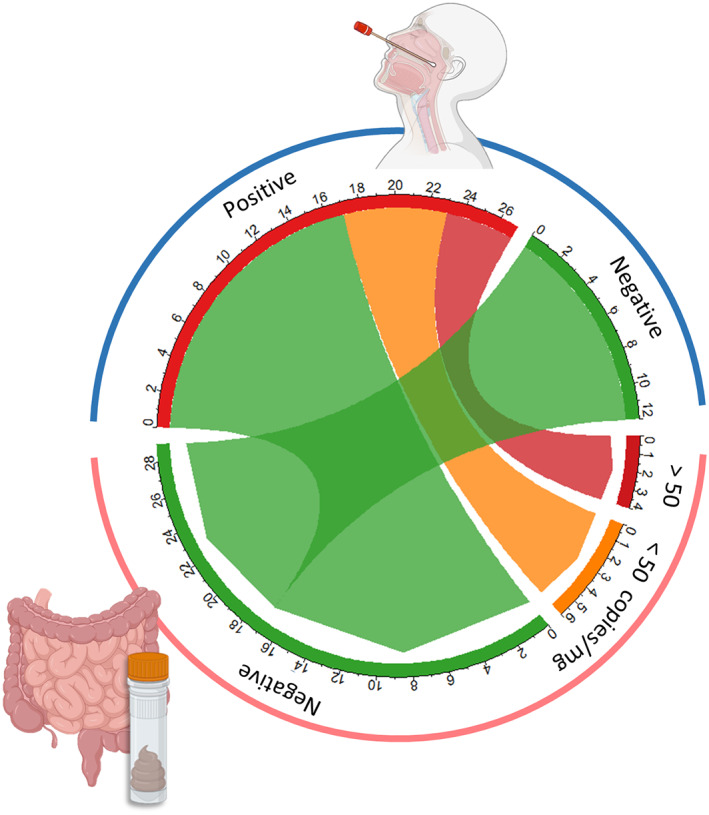
Fig. 2.

Presence of SARS‐CoV‐2 in the gut. Circos plot showing the relationship between RT‐PCR results from nasopharyngeal swab tests (blue arc) and RT‐qPCR results for stool samples (pink arc). The size of each arc section reflects the number of samples falling into each group. Red and orange indicate positive samples with high and low levels of SARS‐COV‐2 respectively; green indicates negative samples.
