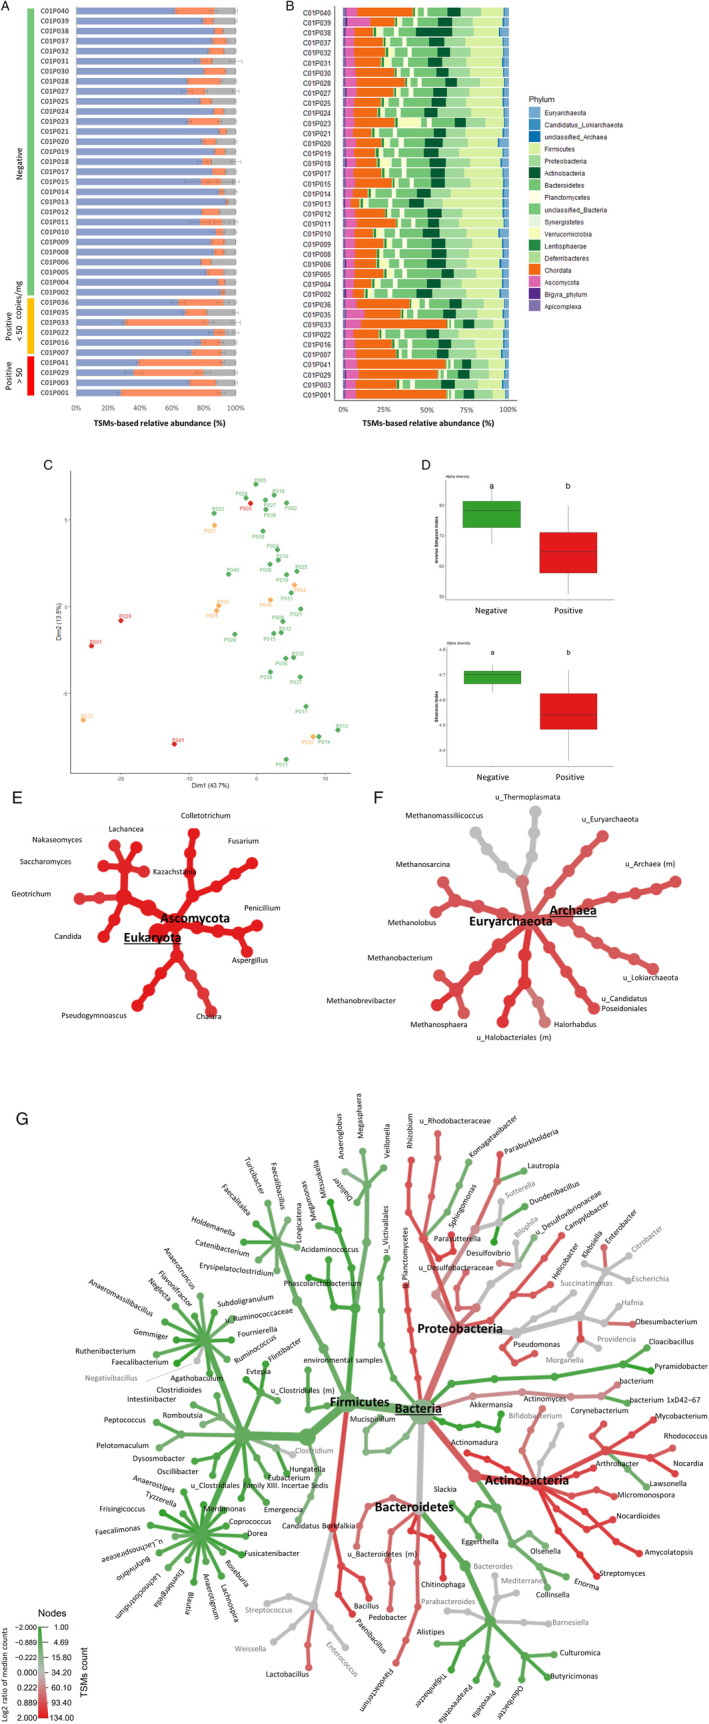
Fig. 3.

Metaproteomic profiling of gut microbiota.
A. Distribution of the assigned TSMs as a function of their origin, microbial (blue), host (orange) or food‐related (grey). Samples are grouped based on their SARS‐CoV‐2 RNA content.
B. Relative biomass contributions of the phyla identified for each sample. Each sample was analysed in three replicates, bars represent average relative abundances for each analysis.
C. PCA plot of the microbiota profiles. Red and orange indicate positive samples with high and low levels of SARS‐COV‐2 respectively; green indicates negative samples. Each point corresponds to one sample, represented as the sum of the contribution of its three corresponding replicates.
D. Box plots showing variation in alpha diversity across age‐matched samples from different groups based on the Inverse Simpson and Shannon indices. Red bars indicate positive samples with high levels of SARS‐COV‐2, green bars indicate negative samples. a, b: significant difference between groups [Tukey's Honest Significant Difference (HSD) test].
E. Differential heat tree for Eukaryota.
F. Differential heat tree for Archaea.
G. Differential heat tree for Bacteria. The trees show comparisons of microbiota compositions between samples containing high levels of SARS‐CoV‐2 RNA and negative samples. Phyla and genera are indicated. Taxa coloured red are more abundant in positive samples, green taxa are more abundant in negative samples.
