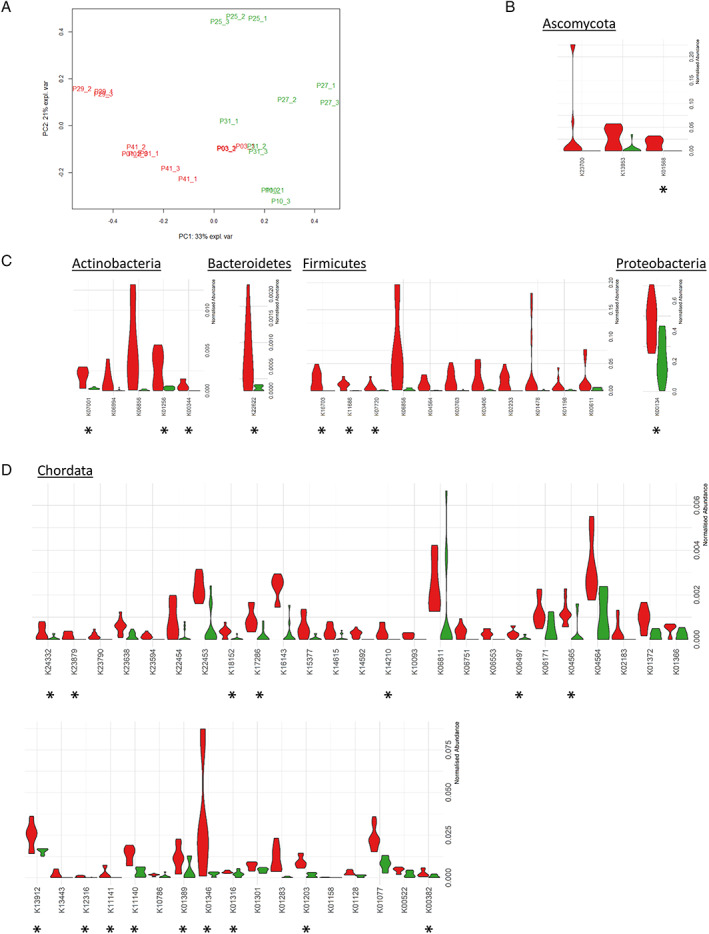
Fig. 4.

Comparative analysis of the functional composition of the metaproteome.
A. PCA analysis of functional microbiota profiles from aged‐matched samples containing high levels of SARS‐CoV‐2‐RNA, or negative for viral RNA.
B. Violin plots showing the relative abundance of the Ascomycota‐related KOs increased in SARS‐CoV‐2‐positive samples (red) or negative samples (green). Asterisks denote KOs that were also significantly increased when compared to levels detected in age‐matched samples containing lower levels of SARS‐CoV‐2 RNA.
C. Violin plots showing the relative abundance of the bacterial‐related KOs increased in SARS‐CoV‐2‐positive samples (red) or negative samples (green). Asterisks denote KOs that were also significantly increased when compared to levels detected in age‐matched samples containing lower levels of SARS‐CoV‐2 RNA.
D. Violin plots showing the relative abundance of host‐related KOs increased in SARS‐CoV‐2‐positive samples (red) compared to negative samples (green). Asterisks denote KOs that were also significantly increased when compared to levels detected in age‐matched samples containing lower levels of SARS‐CoV‐2 RNA.
