
FIGURE 1.
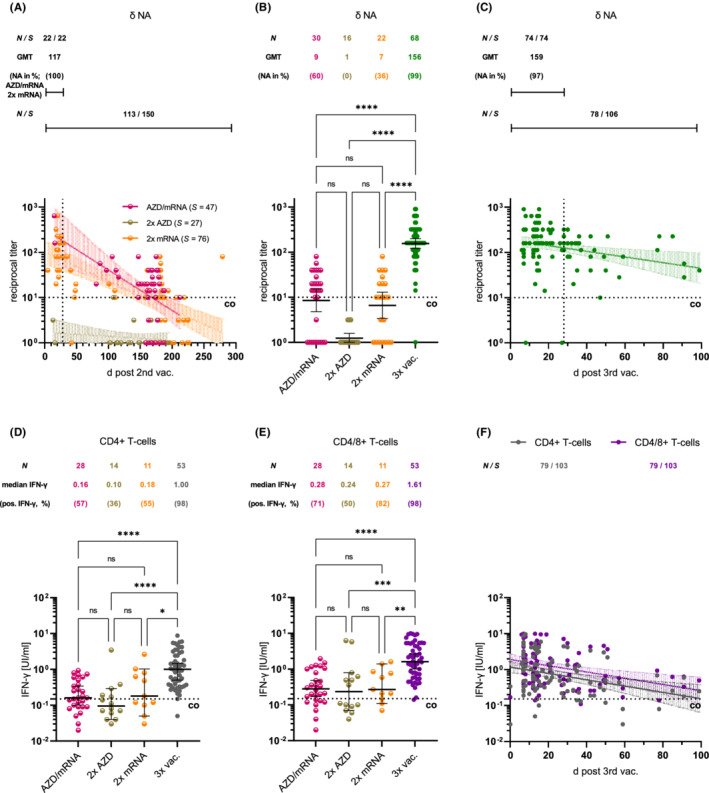
(A, B) Decrease in Delta (δ)‐neutralizing antibody (NA) titers after double vaccination followed by mRNA booster‐induced increase. Geometric mean titers (GMT) and prevalence of titers >1:10 are tabulated. (C) Renewed titer decline. Increase of δ‐NAs four weeks after second (homologous/heterologous) and third mRNA dose (vertical dotted lines; p = 0.04; Mann–Whitney). (D, E) Increase in CD4+ and CD4/CD8+ T‐cell reactivity after mRNA booster. (F) Renewed decrease in T‐cell reactivity. Indicated are the number of individuals (N)/samples (S) tested, and cut‐off values (co). ****p < 0.0001; ***p < 0.001; **p < 0.01; ns: not significant (Kruskal—Wallis)