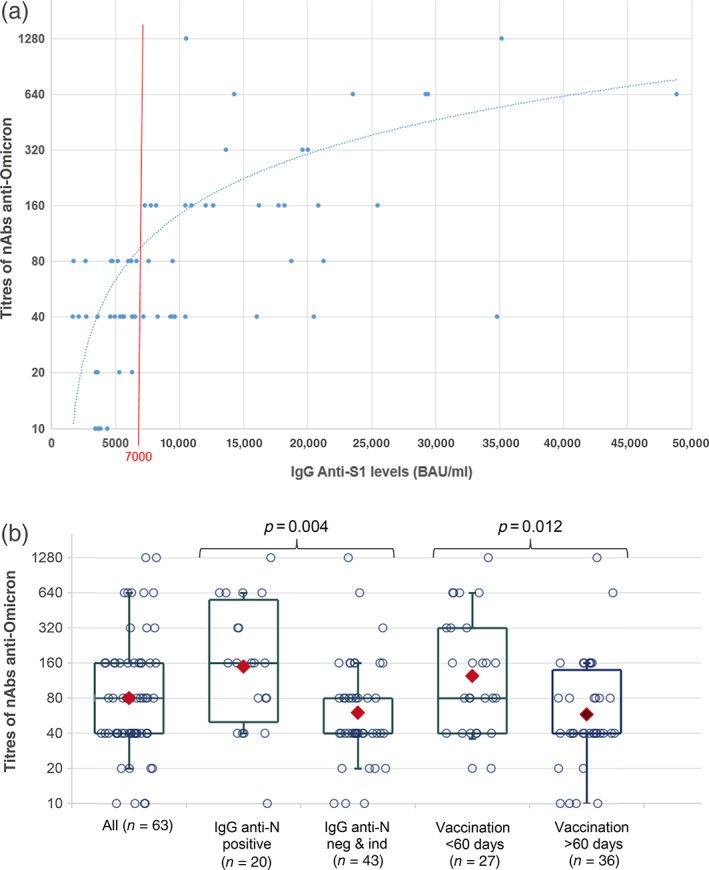
FIGURE 2.

Distribution of SARS‐CoV‐2 anti‐Omicron neutralizing antibody (nAb) titres (log2 scale). (a) According to the IgG anti‐S1 levels (BAU/ml), trend curve is provided (y = 0.016x − 16.563, R 2 = 0.3364); (b) according to the presence of IgG anti‐N and a delay < or ≥60 days between vaccination and plasma donation. The boxes represent the median and interquartile range. The whiskers represent the 10th and 90th percentiles. The red diamonds indicate the geometric mean
