. 2022 Aug 3;130(8):087003. doi: 10.1289/EHP10440

Figure 1.

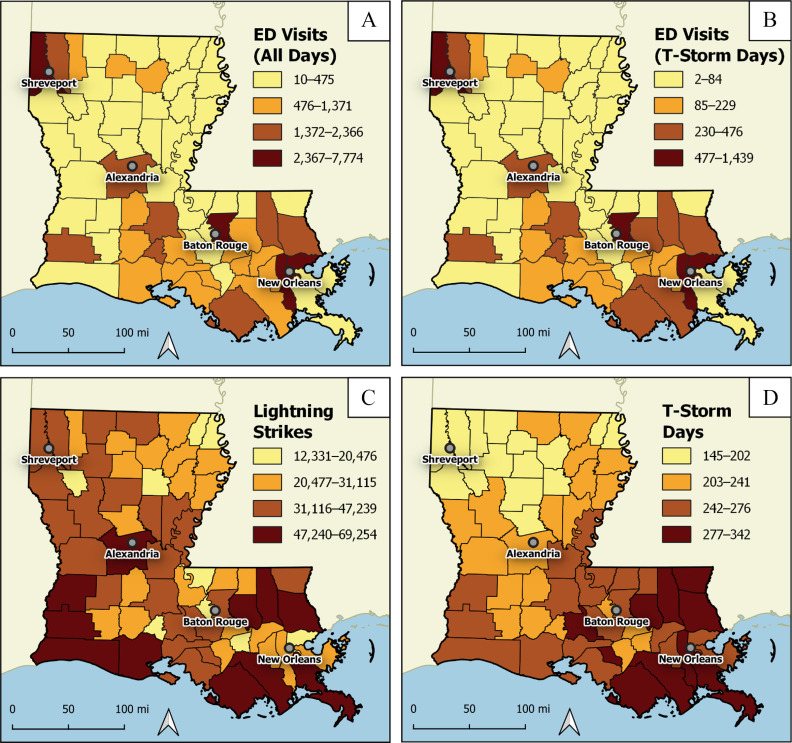
Figure 1A is a map showing the parishes of Louisiana, United States, depicting the number of asthma-related emergency department visits on all days. Shreveport, Alexandra, Baton Rouge, and New Orleans are indicated on the map. The range is divided into four parts, namely, 10 to 475 visits, 476 to 1,371 visits, 1,372 to 2,366 visits, and 2,367 to 7,774 visits. A scale depicting miles is ranging from 0 to 100 in increments of 50. Figure 1B is a map showing the parishes of Louisiana, United States, depicting the number of emergency department visits during thunderstorm days. Shreveport, Alexandra, Baton Rouge, and New Orleans are indicated on the map. The range is divided into four parts, namely, 2 to 84 visits, 85 to 229 visits, 230 to 476 visits, and 477 to 1,439 visits. A scale depicting miles is ranging from 0 to 100 in increments of 50. Figure 1C is a map showing the parishes of Louisiana, United States, depicting the number of ED visits during lightning strikes. Shreveport, Alexandra, Baton Rouge, and New Orleans are indicated on the map. The range is divided into four parts, namely, 12,331 to 20,476 visits, 20,477 to 31,115 visits, 31,116 to 47,239 visits, and 47,240 to 69,254 visits. A scale depicting miles is ranging from 0 to 100 in increments of 50. Figure 1D is a map showing the parishes of Louisiana, United States, depicting the number of ED visits during thunderstorm days. Shreveport, Alexandra, Baton Rouge, and New Orleans are indicated on the map. The range is divided into four parts, namely, 145 to 202 visits, 203 to 241 visits, 242 to 276 visits, and 277 to 342 visits. A scale depicting miles is ranging from 0 to 100 in increments of 50.

Spatial distribution of the number of daily asthma-related ED visits, lightning strikes, and thunderstorm days in Louisiana, 2010–2012 (numerical data in Table S1). The graph presents total number of asthma-related ED visits (A) in all days and (B) on thunderstorm days, (C) total number of cloud-to-ground lightning strikes, and (D) number of thunderstorm days for each Louisiana parish, 2010–2012. Map created using the Free and Open Source QGIS (version 3.16.11; QGIS Development Team). Background map sourced from U.S. Census Bureau (https://www.census.gov/programs-surveys/geography/technical-documentation/naming-convention/cartographic-boundary-file.html). Note: ED, emergency department.