
FIGURE 2.
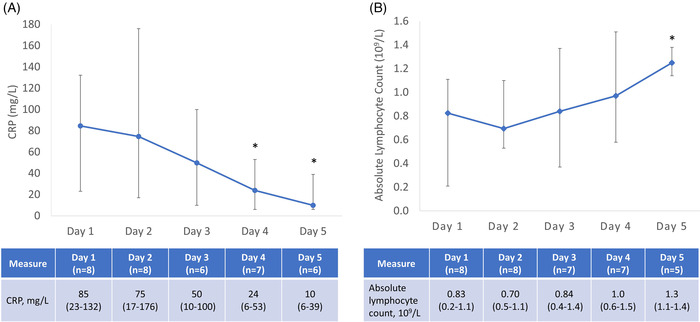
Laboratory trends following treatment with eculizumab. (A) CRP; (B) Absolute lymphocyte count. Data are median (range); CRP, C‐reactive protein; Days represent study day, with the first dose of eculizumab on Day 1 and the second dose on Day 2 per protocol. The number of study participants with laboratory data on each day are provided on the table below each plot. Laboratory data on Days 1 and 4 are pre‐treatment values. Normal range: absolute lymphocyte count (1.0–4.5 × 10⁹/L); C‐reactive protein (<5 mg/L). *Wilcoxon rank‐sum test: CRP, Day 4 versus Day 1 (p = .02) and Day 5 versus Day 1 (p = .005); Absolute lymphocyte count, Day 5 versus Day 1 (p = .01)