FIGURE 5.

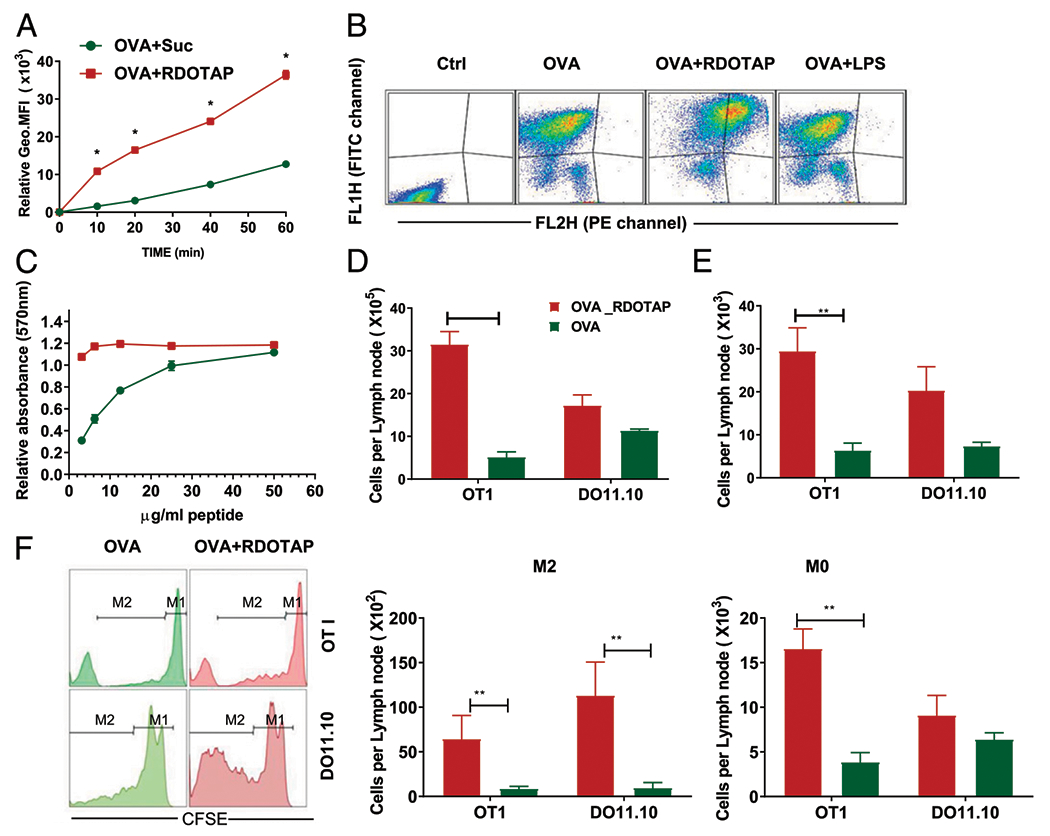
R-DOTAP enhances peptide cross-presentation in vitro and in vivo. (A) BMDCs were incubated with Alexa 647–conjugated OVA admixed with sucrose or R-DOTAP nanoparticles for the indicated times, and the association of OVA with BMDCs was determined by flow cytometry and represented as the geometric mean fluorescence intensity. (B) BMDCs were incubated with DQ-OVA, DQ-OVA plus R-DOTAP (OVA+RDOTAP), or DQ-OVA plus LPS (OVA+LPS) for 60 min, washed, and analyzed by flow cytometry. DQ-OVA processing was measured by assessing the fluorescence in the FITC channel (FL1H) and the fluorescence in the PE-channel (FL2H) representing OVA processing. (C) BMDCs were pulsed for 10 min with the indicated concentrations of OVA241–270 peptide admixed with sucrose (green circles) or R-DOTAP (red squares) and cocultured with B3Z cells overnight. Production of lacZ by OVA peptide-stimulated B3Z was measured using a lacZ colorimetric assay and displayed as relative absorbance compared with untreated B3Z cells. (D-F) C57BL/6 or BALB/c mice were adoptively transferred with CFSE-labeled OT1 or DO11.10 spleen cells and, after 24 h, injected s.c. with 1 μg OVA admixed with 4 mm R-DOTAP (OVA+R-DOTAP) or sucrose buffer (OVA). (D) The total number of cells in the draining popliteal LNs in each treated mouse were enumerated. (E) Total CFSE-labeled cells per LN. (F) Total Ag-specific CD8 T cell expansion was measured by CFSE dilution assay and quantitating cells that have undergone at least one division (M2) or no divisions (M0) using a flow cytometer. n = 4 mice per group. Results represent the mean ± SD. All experiments were repeated at least three times with similar results. *p < 0.05, **p < 0.05.
