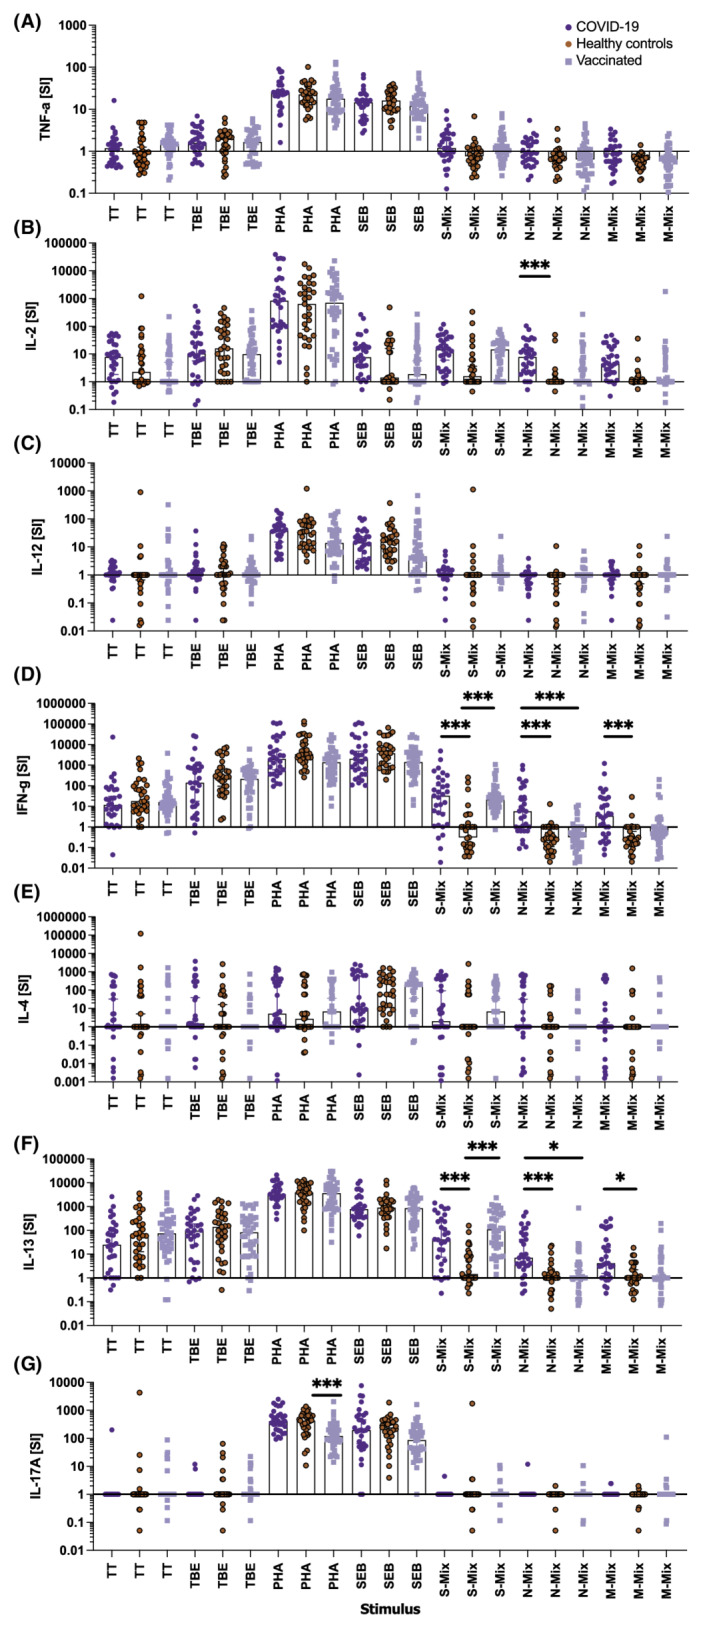
FIGURE 2.

Results of cytokine secretion obtained with gradient‐isolated peripheral blood mononuclear cells (PBMC) stimulated with the indicated antigen‐specific and polyclonal stimuli in classical plate assays. Shown are the stimulation indices (y‐axes) for (A) TNF‐α, (B) IL‐2, (C) IL‐12p70, (D) IFN‐γ, (E) IL‐4, (F) IL‐13, and (G) IL‐17A produced after incubation of 1 x 10⁵ PBMC per well co‐incubated with the indicated stimuli (x‐axes) for 144 h. Bars represent the median, whiskers the Hodges‐Lehmann 95% confidence intervals, dark blue circles show COVID‐19 convalescent patients, red circles those of non‐exposed healthy controls, and light blue squares vaccinees. M‐mix, SARS‐CoV‐2 matrix protein peptide mix; N‐mix, SARS‐CoV‐2 nucleocapsid protein peptide mix; PHA, phytohemagglutinin; S‐mix, SARS‐CoV‐2 spike protein peptide mix; SEB, Staphylococcal enterotoxin B; TBE, tick borne encephalitis antigen; TT, tetanus toxoid. Data show the summary of 31 COVID‐19 convalescent patients, 32 healthy controls, and 40 vaccinees. p values were calculated by Tuckey's test. Only significant differences are shown. *p < .05; ***p < .001
