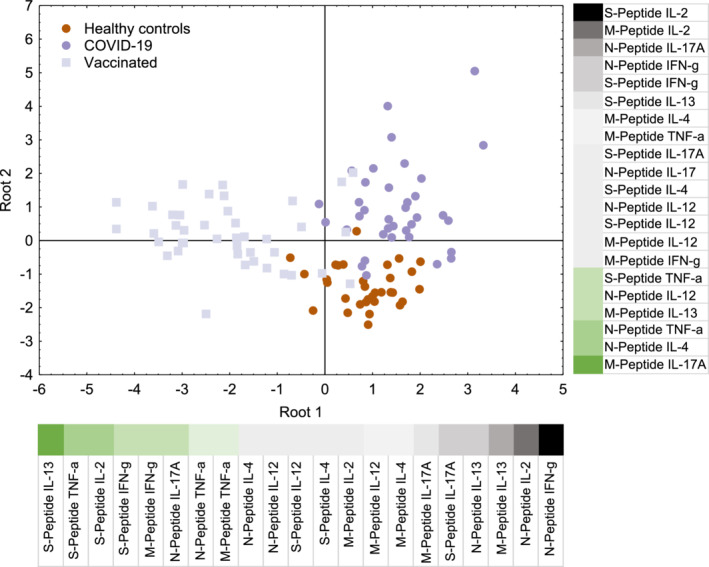
FIGURE 4.

Discriminant analysis of whole blood (WB) cytokine responses after stimulation with SARS‐CoV‐2 peptide mixes and using Th1, Th2, Th17, and inflammatory cytokines as readout. Shown is the impact on discrimination of the release of the 7 cytokines upon stimulation of the WB of the three study groups with the S‐, N‐, or M‐peptide mixes. High positive weights are indicated by black and large negative ones by dark green color. Both roots are highly significant (p < .001)
