
FIGURE 5.
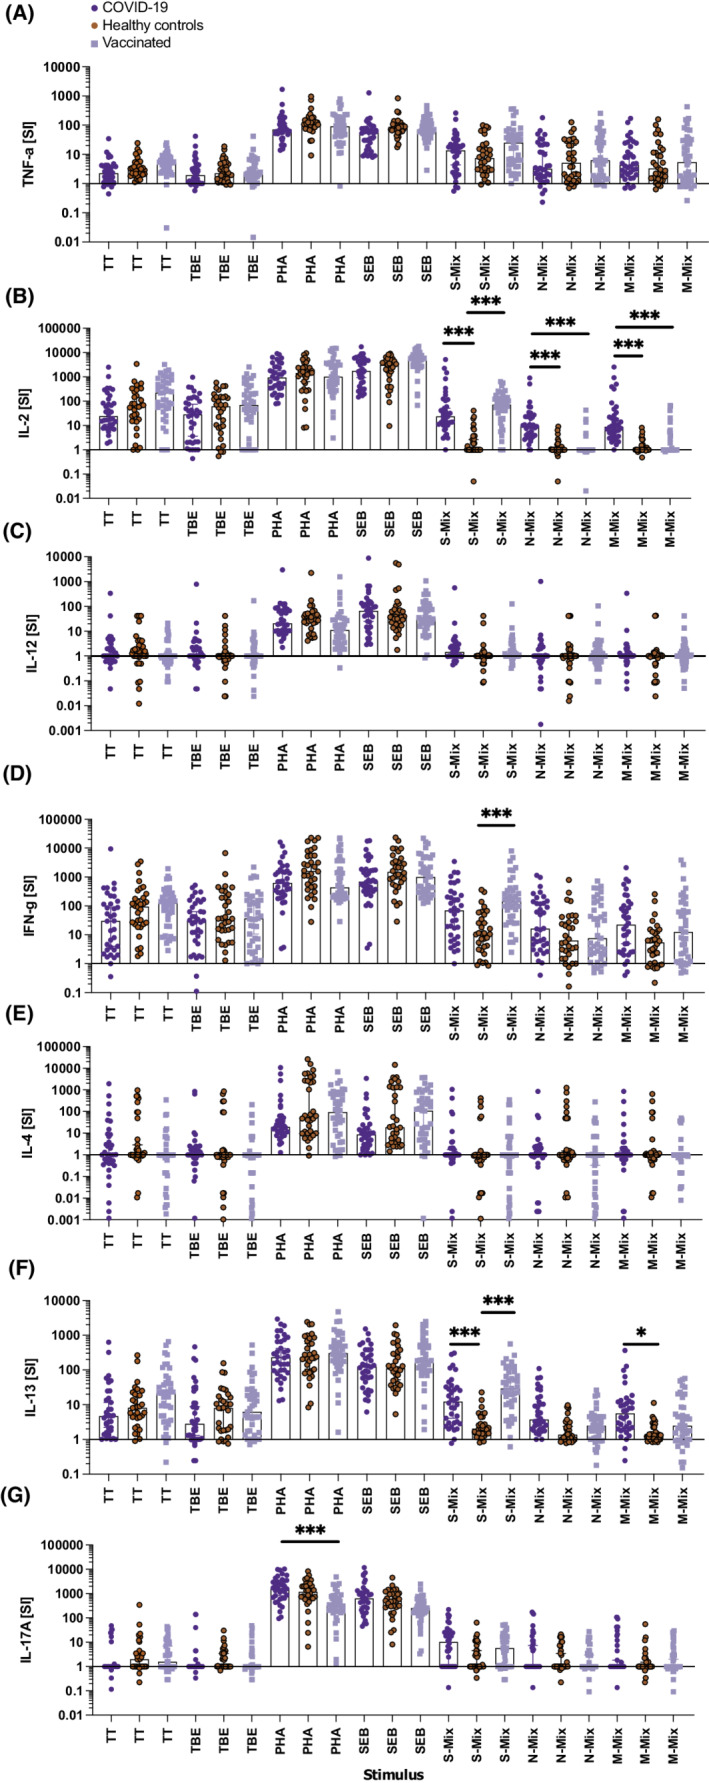
Cytokine responses of whole blood (WB) cultures clearly separate COVID‐19 convalescent patients and SARS‐CoV‐2 vaccinated subjects from non‐exposed healthy control individuals. Shown are the stimulation indices (SI, y‐axes) for (A) TNF‐α, (B) IL‐2, (C) IL‐12p70, (D) IFN‐γ, (E) IL‐4, (F) IL‐13, and (G) IL‐17A produced after incubation of whole blood samples with the indicated stimuli (x‐axes) for 44 h. Bars represent the median, whiskers the Hodges‐Lehmann 95% confidence intervals dark blue circles show COVID‐19 convalescent patients, red circles those of non‐exposed healthy controls and light blue squares vaccinees. M‐mix, SARS‐CoV‐2 matrix protein peptide mix; N‐mix, SARS‐CoV‐2 nucleocapsid protein peptide mix; PHA, phytohemagglutinin; S‐mix, SARS‐CoV‐2 spike protein peptide mix; SEB, Staphylococcal enterotoxin B; TBE, tick borne encephalitis antigen; TT, tetanus toxoid. Data show the summary of 36 COVID‐19 convalescent patients, 32 healthy controls, and 41 vaccinees. p values were calculated by Tuckey's test Only significant differences are shown. *p < .05; ***p < .001