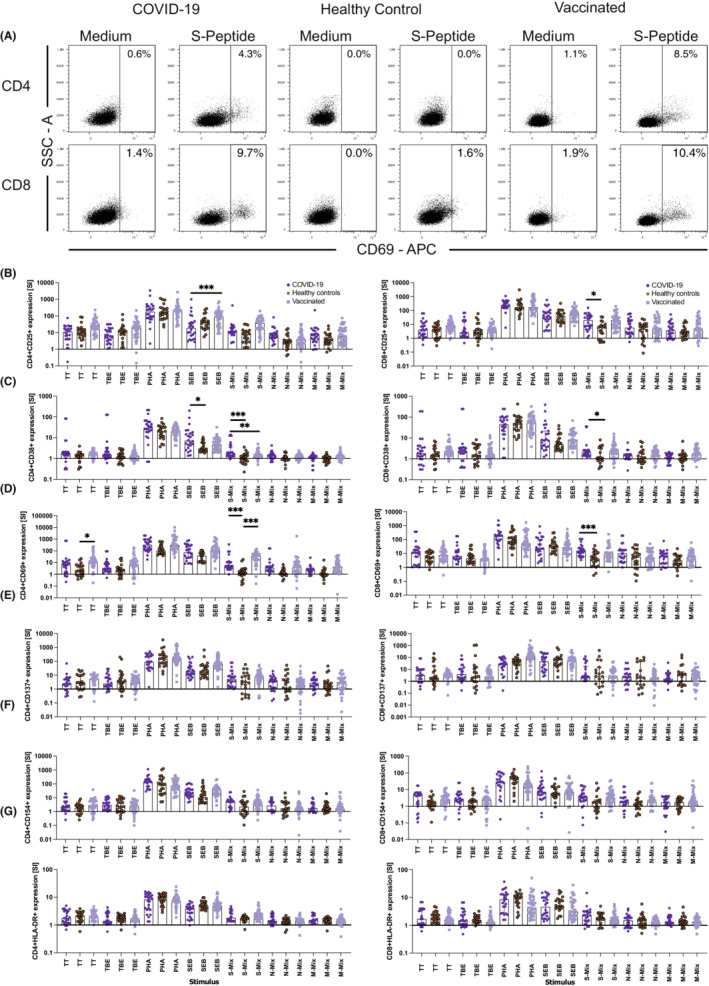
FIGURE 6.

Activation‐induced marker (AIM) expression on CD4+ and CD8+ T lymphocytes help to distinguish COVID‐19 convalescent patients and SARS‐CoV‐2 vaccinated subjects from non‐exposed healthy control individuals. Shown are representative flow cytometry dot plots depicting side scatter (y‐axes) and CD69 expression (x‐axes) (A) and summary graphs (B to G) quantifying the changes (SI, y‐axes) in (B) CD25, (C) CD38, (D) CD69, (E) CD137, (F) CD154, and (G) HLA‐DR cell surface expression on CD4+ (left panels) and CD8+ (right panels) T cells of COVID‐19 convalescent individuals (dark blue circles), unexposed healthy control individuals (red circles), and vaccinated subjects (light blue squares). Data show the summary of 24 COVID‐19 convalescent patients, 23 non‐exposed healthy controls and 39 vaccinees. p values were calculated by Tuckey's test. Only significant differences are shown. *p < .05; **p < .01; ***p < .001
