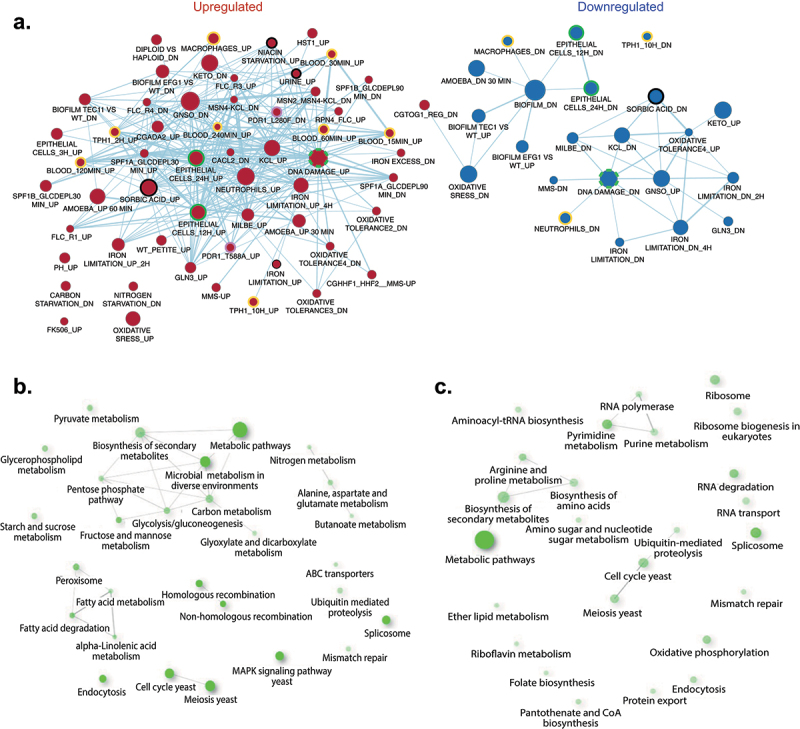
Figure 3.

(a) GSEA (Gene set enrichment analysis) of C. glabrata genes regulated in vivo. The gene list was produced from data in file S4 (“Cg14.Gmt”), in which genes with P values of ≤0.05 and log fold-change ≥ 2 (in vivo compared to in vitro) were chosen. The Cg14.Gmt file contains 167 differential expression data sets from published transcriptional data performed with C. glabrata. The list was then imported into the GSEA software 4.10. Analysis parameters were as follows: norm, meandiv; scoring_scheme, weighted; set_min, 15; nperm, 1000; set_max, 500. GSEA results were uploaded into cytoscape 3.0 with the following parameters: P value cut-off, 0.01; FDR q value, 0.05. Red nodes represent enriched gene lists in upregulated genes from the GSEA. Blue nodes represent enriched gene lists in downregulated genes from the GSEA. Nodes are connected by edges when overlaps exist between nodes. The size of nodes reflects the total number of genes that are connected by edges to neighbouring nodes. Edge thickness reflects the level of confidence between nodes. Labels of nodes indicate specific classes of genes listed in the Cg14.Gmt file. (b) and (c) KEGG pathway enrichment of C. glabrata genes up- and down regulated regulated in vivo, respectively. The enrichment analysis was performed with the online tool ShinyGO (http://bioinformatics.Sdstate.edu/go/) [42] with a filtered C. glabrata gene list of up- and down-regulated genes (log2(fc) ≥ 2 compared to in vitro growth)
