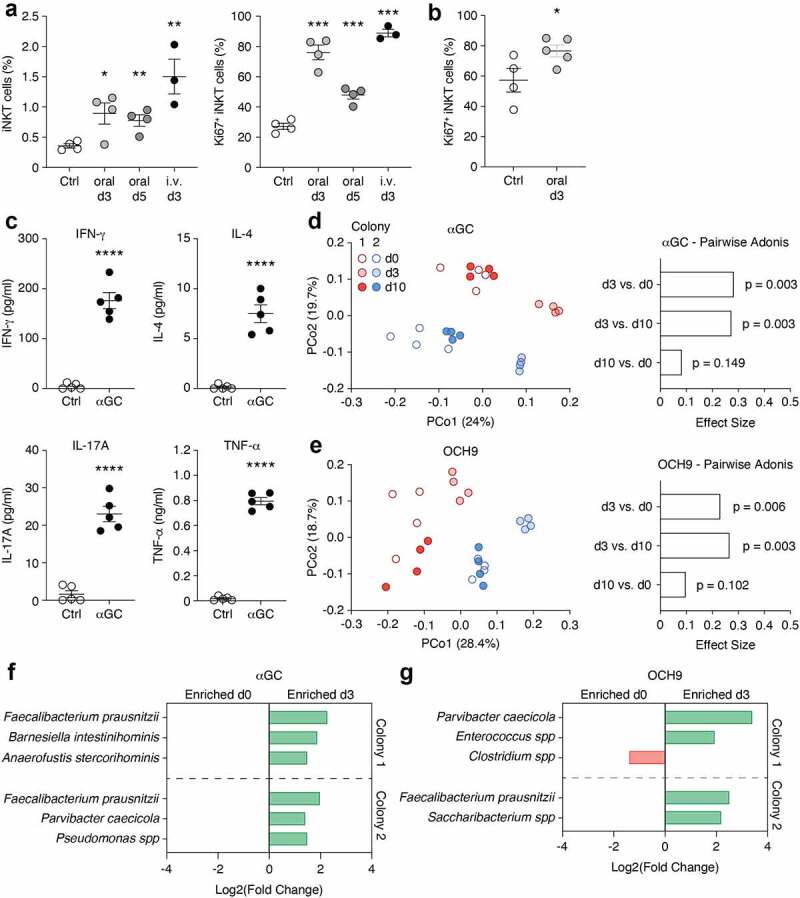
Figure 4.

iNKT cell activation transiently affects microbiota composition. (a) C57BL/6 mice were administered 2 μg αGC or vehicle control (Ctrl) orally, or 0.5 μg αGC intravenously (i.v.) and their mLN were analyzed at d3 and d5 (for oral) and d3 (i.v.). (b) C57BL/6 mice were administered 2 μg αGC or vehicle control (Ctrl) and their colons were analyzed at d3. The data shows the frequency of iNKT cells out of live CD19− lymphocytes (a) as well as the frequency of Ki67+ iNKT cells (a, b). (c) C57BL/6 mice were administered 2 μg αGC or vehicle control (Ctrl). At d3, colon biopsy punches were cultured for 48 h and cytokines production was assessed using a multiplex cytokine array. Data shows individual and mean values ± s.e.m. (n = 3 to 5 mice per group). *p < 0.05, **p < 0.01, *** p < 0.001, **** p < 0.0001, Unpaired Student t test (a-c). (d, e) 16S bacterial rRNA sequencing was used to define the microbiota profiles of mice before (d0). 3 (d3) and 10 days (d10) after the oral gavage of αGC (d) or OCH9 (e). These groups were separated by principal coordinates PCo1 and PCo2, collectively explaining 43.7% (d) and 47.1% (e) of the total similarity between samples, based on Bray-Curtis distances (left panels). Pairwise Adonis comparison of microbiota composition at d0, d3 and d10 following αGC (d) or OCH9 (e) administration is shown (right panels). (f, g) MetagenomeSeq analysis shows differentially abundant OTUs before (d0) and after (d3) oral administration of αGC (f) or OCH9 (g).
