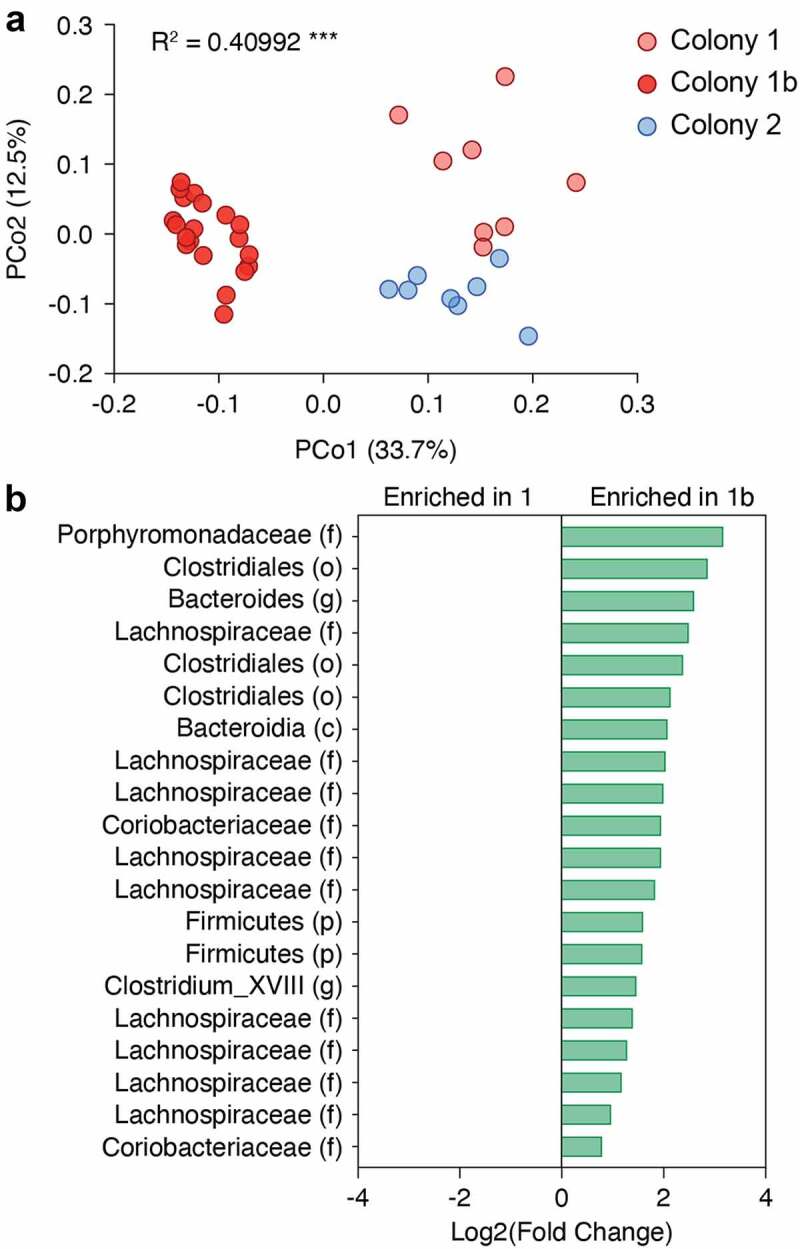
Figure 5.

The composition of the microbiota in C57BL/6 mice shifts over time. (a) 16S bacterial rRNA sequencing was used to define the microbiota profiles of C57BL/6 mice sampled from the same colony one year apart (colonies 1, n = 8, and 1b, n = 20) and from a separate colony (colony 2, n = 8). These groups were separated by principal coordinates PCo1 and PCo2, collectively explaining 46.2% of the total similarity between samples, based on Bray-Curtis distances. (b) MetagenomeSeq analysis shows the top 10 most enriched OTUs in colony 1 and the 5 OTUs enriched in colony 1b. Log2 fold-change values are shown.
