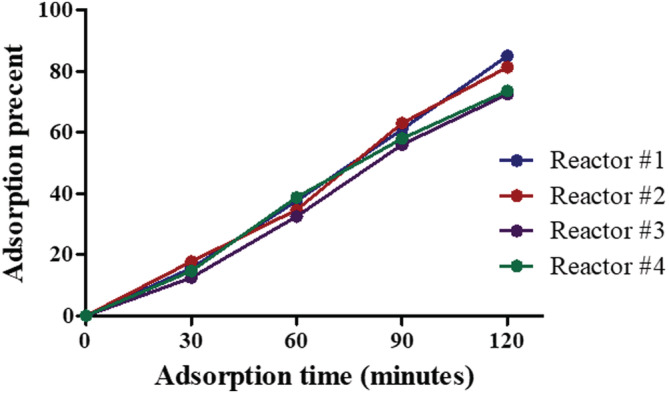
FIGURE 2.

Adsorption percentages over time in representative reactors. Each reactor was inoculated with a different number of cells, and adsorption was monitored every 30 min up to 3 h. Percentages of adsorption were calculated for every reactor and each time point
