
Figure 3.
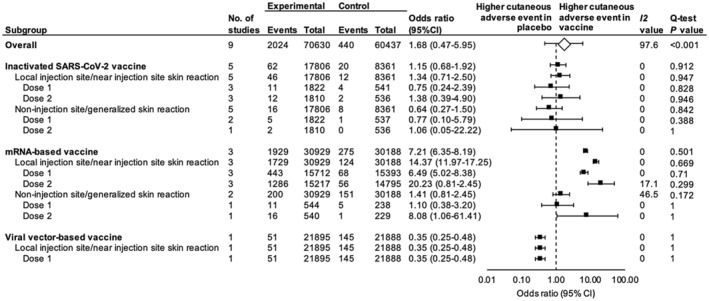
Forest plots of the pooled odds ratios for cutaneous adverse events in COVID‐19 vaccine recipients versus placebo. *Square data markers represent the odds ratios. The diamond data marker represents the overall effect size based on included studies. Lines around the marker indicate 95% CI.