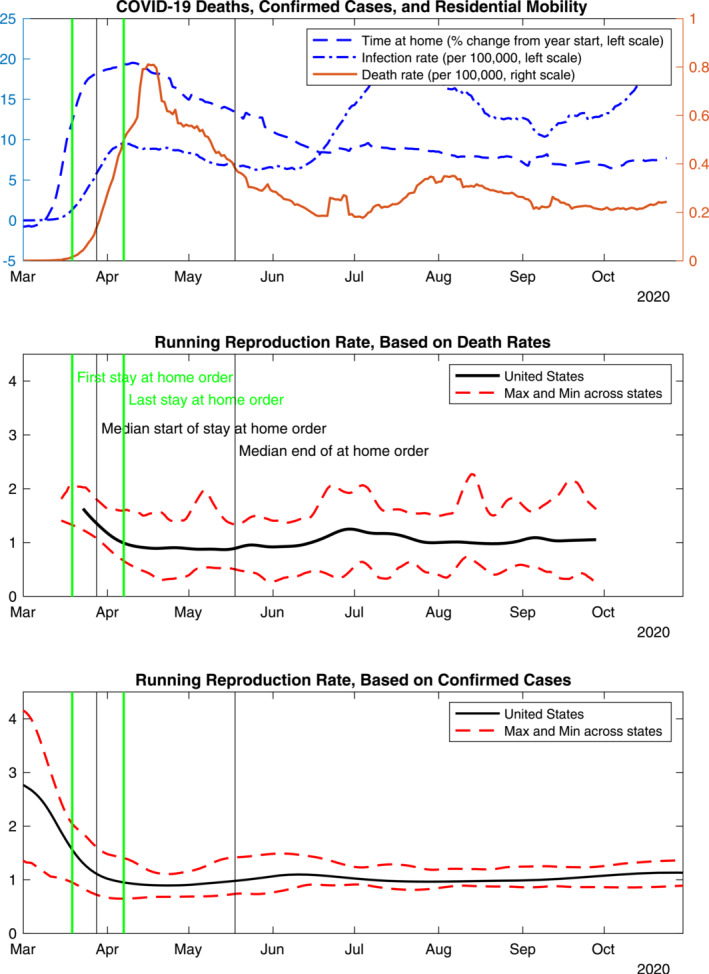
Figure 1.

Stay‐at‐home orders, mobility, COVID‐19 death and infection rates—7‐day moving average. Note: The vertical lines denoting key dates are repeated in each panel. Sources: The data for death rates and confirmed cases are from JHU (2020). The data on stay‐at‐home orders are from Raifman et al. (2020). The residential mobility data are from Google (2020). The estimates of the reproduction rate based on deaths are from Fernández‐Villaverde and Jones (2020). The estimates of the reproduction rate based on confirmed cases are from Systrom, Vladek, and Krieger (2020).
