
Figure 3.
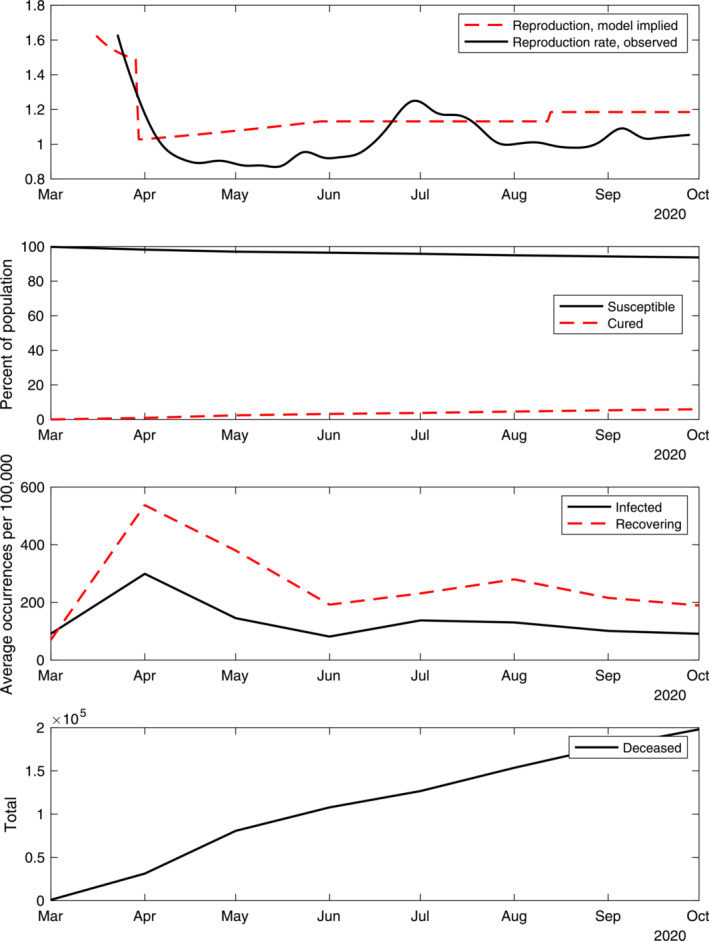
Dynamics in the SIRD model. Note: The paths shown are aggregates for the total population. The observed reproduction rate is used in the model simulations and to back out the paths in the bottom three panels. The model‐implied paths are generated varying the number of contacts in line with the residential mobility measure from Google (2020) and school closures but keeping the probability of contagion given contacts unchanged from its baseline value. The paths in the top panel are daily. All other panels show monthly averages of daily series.