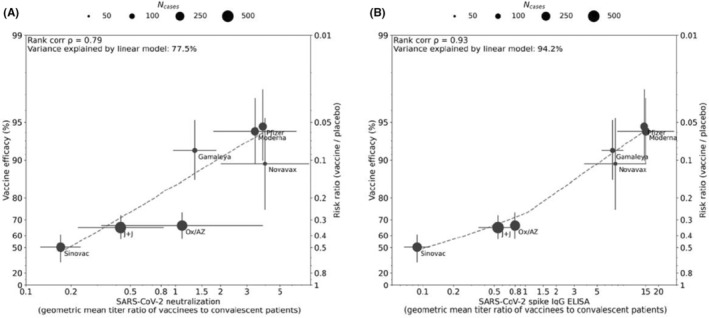
FIGURE 1.

Correlation between antibody responses and efficacy rate for 7 COVID‐19 vaccines. Panels A and B display correlations of antibody responses for neutralization and ELISA assay ratios, respectively, normalized to HCS panel titers from the same assay. Dot size corresponds to the number of cases reported for Phase III efficacy analyses. The y‐axis is estimated log risk ratio reported on the vaccine efficacy scale. The x‐axis is ratio of the peak geometric mean neutralization titer or ELISA titer at 7‐28 days post‐vaccination, relative to HCS. Error bars indicate 95% confidence Intervals (except for Oxford/AZ antibody responses, which represent ratios of median titers with interquartile ranges) with dashed line showing non‐parametric LOESS fit. A rank correlation value was calculated with R2 in a linear model utilized for variance explanation. Reprinted from Vaccine Volume 39, Earle KA, Ambrosino DM, Fiore‐Gartland A, et al. Evidence for Antibody as a protective correlate for COVID‐19 vaccines, 4423‐4428, 2021
