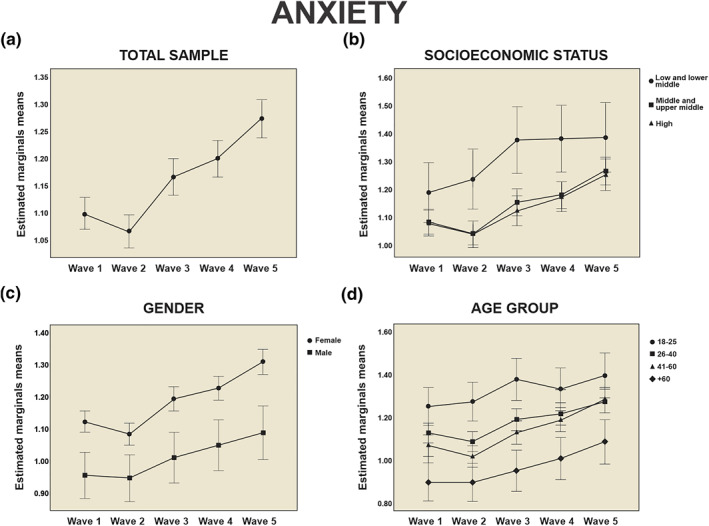
FIGURE 1.

Comparison of the adjusted mean of the anxiety symptoms according to the different socioeconomic and demographic variables, during the five waves of the study. Figure 1 compares the adjusted means for anxiety (1A‐1D) in total sample and according to the different socioeconomic (socioeconomic status) and demographic (gender and age group) variables during the five phases of the study (Wave 1–5). Error bars +/− 2SD
