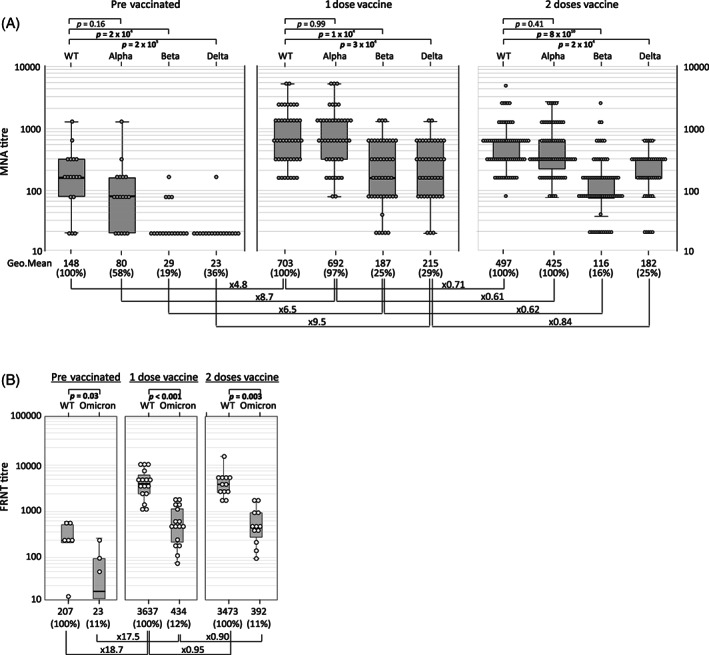
FIGURE 1.

Comparison of neutralizing antibody titers against each SARS‐CoV‐2 strain in plasma from infected, prevaccinated individuals with those receiving 1 or 2 doses of vaccine obtained by microneutralization assay (A) and focus reduction neutralization assay (B). Median values of reactivity and fold change from reactivity to the WT strain are shown under each graph. Further comparisons of fold‐changes in reactivity after immunization with 1 or 2 vaccine doses are shown along links. Statistical comparisons of antibody levels induced by different SARS‐CoV‐2 strains used the Spearman rank correlation test (p values <.05 shown in bold).
