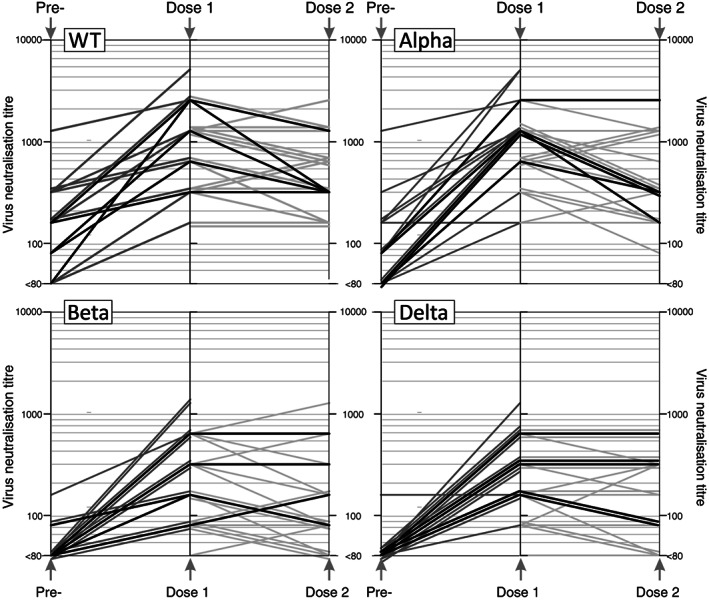
FIGURE 2.

Time course of neutralizing antibody levels to each SARS‐CoV‐2 strain in sequential samples from pre‐ and post‐vaccinated subjects (time intervals and totals listed in Table S1); gray lines indicate results from subjects with samples collected pre‐ and post‐single vaccine does, or between dose 1 and dose 2 vaccinations.
